option = {
backgroundColor: '#142468',
title:{
//text: '实时旋转饼图'
},
series: [
{
type: 'pie',
zlevel: 1,
silent: true,
/*
radius
饼图的半径。可以为如下类型:
number:直接指定外半径值。
string:例如,'20%',表示外半径为可视区尺寸(容器高宽中较小一项)的 20% 长度。
Array.:数组的第一项是内半径,第二项是外半径。每一项遵从上述 number string 的描述。
*/
radius: ['98%', '97%'],
hoverAnimation: false,
color: "rgba(88,142,197,0.5)",
// animation:false, //charts3 no
label: {
normal: {
show: false
},
},
labelLine: {
normal: {
show: false
}
},
data: [1]
},
{
type: 'pie',
zlevel: 2,
silent: true,
radius: ['90%', '91%'],
startAngle: 50,
hoverAnimation: false,
// animation:false, //charts3 no
label: {
normal: {
show: false
},
},
labelLine: {
normal: {
show: false
}
},
data: _pie2()
},
{
type: 'pie',
zlevel: 3,
silent: true,
radius: ['88%', '87%'],
label: {
normal: {
show: false
},
},
labelLine: {
normal: {
show: false
}
},
data: _pie2()
},
{
type: 'pie',
zlevel: 4,
silent: true,
radius: ['84%', '83%'],
label: {
normal: {
show: false
},
},
labelLine: {
normal: {
show: false
}
},
data: _pie3()
},
{
type: 'pie',
zlevel: 5,
silent: true,
radius: ['80%', '78%'],
color: ["#fc8d89", "#46d3f3", "rgba(203,203,203,.2)"],
startAngle: 50,
hoverAnimation: false,
// animation:false, //charts3 no
label: {
normal: {
show: false
},
},
data: [50, 20, 40]
},
{
name: "",
type: 'gauge',
splitNumber: 30, //刻度数量
min: 0,
max: 100,
radius: '73%', //图表尺寸
center: ['50%', '50%'],
startAngle: 90,
endAngle: -269.9999,
axisLine: {
show: false,
lineStyle: {
width: 0,
shadowBlur: 0,
color: [
[1, '#0dc2fe']
]
}
},
axisTick: {
show: false,
lineStyle: {
color: 'auto',
width: 2
},
length: 20,
splitNumber: 5
},
splitLine: {
show: true,
length: 32,
lineStyle: {
color: 'auto',
}
},
axisLabel: {
show: false
},
pointer: { //仪表盘指针
show: 0,
},
detail: {
show: 0,
},
},
{
name: '统计',
type: 'gauge',
splitNumber: 30, //刻度数量
min: 0,
max: 100,
radius: '68%', //图表尺寸
center: ['50%', '50%'],
startAngle: 90,
endAngle: -269.9999,
axisLine: {
show: true,
lineStyle: {
width: 0,
shadowBlur: 0,
color: [
[0, '#0dc2fe'],
[1, '#0dc2fe']
]
}
},
axisTick: {
show: true,
lineStyle: {
color: '#0dc2fe',
width: 2
},
length: 20,
splitNumber: 5
},
splitLine: {
show: true,
length: 20,
lineStyle: {
color: '#0dc2fe',
}
},
axisLabel: {
show: false
},
pointer: { //仪表盘指针
show: 0,
},
detail: {
borderColor: '#fff',
shadowColor: '#fff', //默认透明
shadowBlur: 2,
offsetCenter: [0, '0%'], // x, y,单位px
textStyle: { // 其余属性默认使用全局文本样式,详见TEXTSTYLE
color: '#fff',
fontSize: 50,
},
formatter: '{value}'
},
data: [{
name: "",
value: 2020
}]
},
{
type: 'pie',
zlevel: 20,
silent: true,
radius: ['60%', '59%'],
hoverAnimation: false,
color: '#2dc0c9',
// animation:false,
data: [1],
labelLine: {
normal: {
show: false
}
}
},
{
name: '中间环形图',
type: 'pie',
radius: ['35%', '55%'],
avoidLabelOverlap: false,
hoverAnimation: false,
itemStyle: {
normal: {
color: '#80ADD2',
borderColor: '#3D4268',
}
},
label: {
normal: {
show: false,
position: 'center',
},
emphasis: {
show: true,
textStyle: {
fontSize: '30',
fontWeight: 'bold'
}
}
},
labelLine: {
normal: {
show: false
}
},
data: [
25, 25, 25, 25, 25, 25
]
},
]
};
function _pie1() {
let dataArr = [];
for (var i = 0; i < 8; i++) {
dataArr.push({
name: (i + 1).toString(),
value: 20,
itemStyle: {
normal: {
color: "rgba(88,142,197,0.4)",
borderWidth: 0,
borderColor: "rgba(0,0,0,0)"
}
}
})
}
return dataArr
}
function _pie2() {
let dataArr = [];
for (var i = 0; i < 8; i++) {
if (i % 2 === 0) {
dataArr.push({
name: (i + 1).toString(),
value: 25,
itemStyle: {
normal: {
color: "rgba(88,142,197,0.5)",
borderWidth: 0,
borderColor: "rgba(0,0,0,0)"
}
}
})
} else {
dataArr.push({
name: (i + 1).toString(),
value: 20,
itemStyle: {
normal: {
color: "rgba(0,0,0,0)",
borderWidth: 0,
borderColor: "rgba(0,0,0,0)"
}
}
})
}
}
return dataArr
}
function _pie3() {
let dataArr = [];
for (var i = 0; i < 100; i++) {
if (i % 2 === 0) {
dataArr.push({
name: (i + 1).toString(),
value: 25,
itemStyle: {
normal: {
color: "rgb(126,190,255)",
borderWidth: 0,
borderColor: "rgba(0,0,0,0)"
}
}
})
} else {
dataArr.push({
name: (i + 1).toString(),
value: 20,
itemStyle: {
normal: {
color: "rgba(0,0,0,0)",
borderWidth: 0,
borderColor: "rgba(0,0,0,0)"
}
}
})
}
}
return dataArr
}
function _pieData(data) {
let _data = data;
let dataArr = [];
for (var i = 0; i < 5; i++) {
if (i === 2) {
let dt = (data[0].unit) ? 25 : (Number(data[0].value));
dataArr.push({
name: (i + 1).toString(),
value: dt,
itemStyle: {
normal: {
color: new echarts.graphic.LinearGradient(0, 1, 1, 0, [{
offset: 0,
color: 'rgb(147,187,216)'
}, {
offset: 1,
color: '#588ec5'
}]),
borderWidth: 0,
borderColor: "rgba(0,0,0,0.4)"
}
}
})
} else {
let dta = (data[0].unit) ? 25 : (1 - Number(data[0].value)) / 4;
dataArr.push({
name: (i + 1).toString(),
value: dta,
itemStyle: {
normal: {
color: "rgba(0,0,0,0)",
borderWidth: 0,
borderColor: "rgba(0,0,0,0)"
}
}
})
}
}
//console.log(dataArr)
return dataArr
}
//鼠标事件:'click','dblclick','mousedown','mouseup','mouseover','mouseout','globalout'。
myChart.on('mouseover', function(params) {
stopTimer();
});
myChart.on('mouseout', function(params) {
startTimer();
});
var timer;
function doing() {
let option = myChart.getOption();
option.series[3].startAngle = option.series[3].startAngle - 1;
option.series[6].data[0].value = option.series[6].data[0].value + 1;
myChart.setOption(option);
}
function startTimer() {
timer = setInterval(doing, 100);
}
function stopTimer() {
clearInterval(timer);
xzTimer = null;
}
setTimeout(startTimer, 500);
/*
window.onload = function() {
setTimeout(startRotate, 500);
}
*/
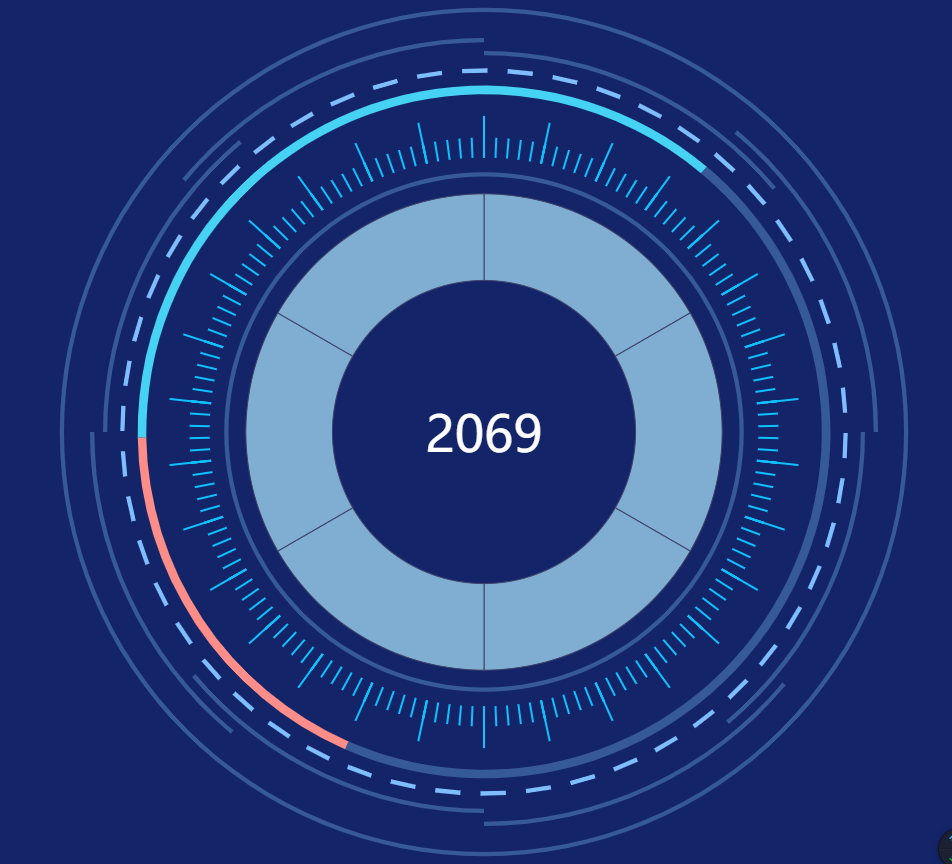
效果图: