<!DOCTYPE html>
<html>
<head>
<meta charset="utf-8">
<title></title>
<script src="echarts.js"></script>
<style>
html{
width: 100%;
height:100%
}
body{
width: 100%;
height:100%;
}
.contain{
width: 100%;
height:100%;
background-color:#000a2d;
overflow: hidden;
}
.item{
width: 100px;
height: 100px;
margin-top: 50px;
}
</style>
</head>
<body>
<div class="contain">
<div style="display: flex;">
<div class="item">
<div id="main" style="width: 100px;height:140px;"></div>
</div>
<div class="item">
<div id="main1" style="width: 100px;height:140px;"></div>
</div>
<div class="item">
<div id="main2" style="width: 100px;height:140px;"></div>
</div>
</div>
</div>
<script type="text/javascript">
// 基于准备好的dom,初始化echarts实例
echartsData('main')
echartsData('main1')
echartsData('main2')
function echartsData(id){
var myChart = echarts.init(document.getElementById(id));
// 指定图表的配置项和数据
option = {
tooltip: {
trigger: 'item',
formatter: '{a} <br/>{b}: {c} ({d}%)'
},
legend: {
orient: 'vertical',
bottom: -5,
itemWidth:8,
itemHeight:8,
data: ['直接访问', '邮件营销', '联盟广告', '视频广告', '搜索引擎'],
textStyle:{
color: '#fff',
fontSize:12,
}
},
series: [
{
name: '访问来源',
type: 'pie',
radius: ['50%', '70%'],
center : [ '45%', '30%' ],
avoidLabelOverlap: false,
top :0,
color:['#feca29','#f33131','#56d19b'],
label: {
show: false,
position: 'center',
// fontSize :12,
},
emphasis: {
label: {
show: true,
fontSize: '12',
fontWeight: 'bold'
}
},
labelLine: {
show: false
},
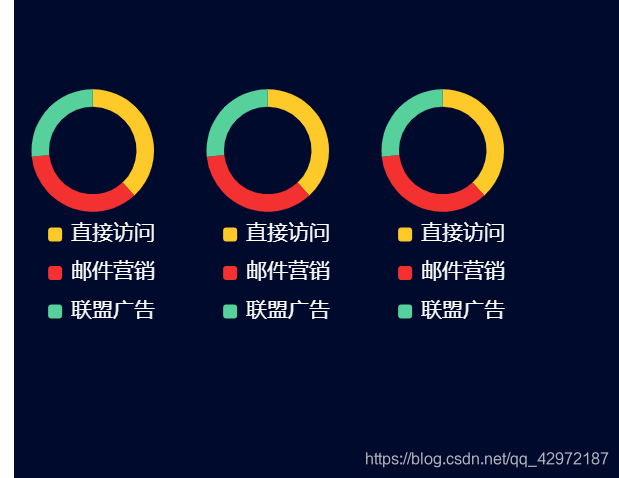
data: [
{value: 335, name: '直接访问'},
{value: 310, name: '邮件营销'},
{value: 234, name: '联盟广告'},
]
}
]
};
// 使用刚指定的配置项和数据显示图表。
myChart.setOption(option);
}
</script>
</body>
</html>
版权声明:本文为qq_42972187原创文章,遵循CC 4.0 BY-SA版权协议,转载请附上原文出处链接和本声明。