echarts 饼图,tooltip设置show:true,悬浮效果不生效,还是没有提示气泡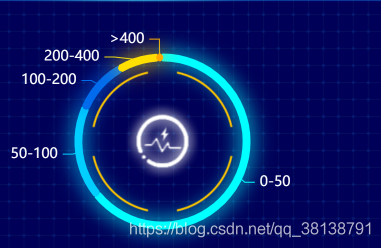
我的代码:
option = {
color: color,
graphic: {
elements: [{
type: “image”,
z: 3,
style: {
image: img,
width: 140,
height: 140
},
left: ‘center’,
top: ‘center’,
        },{
            type: "image",
            z: 3,
            style: {
                image: 'lx/icons/lsfx/icon.png',
                width: 76,
                height: 76
            },
            left: 'center',
            top: 'center',

        }],
    },
    tooltip: {
        show: true
    },
    legend: {
        icon: "roundRect",
        orient: 'horizontal',
        right: '6%',
        bottom: 'center',
        itemWidth: 8,
        itemHeight: 42,
        itemGap:30,
        data:['0-50','50-100','','100-200','200-400'],
        textStyle: {
            color: "#fff",
            fontSize: 16,
            textAlign: 'center',
            rich: {
                hr: {
                    width: '6',
                    height: 1,
                    backgroundColor: '#fff',

                },
                a0:{
                    fontSize:22,
                    align: 'center',
                    color:'#00FFFF',
                    padding:[5,0]
                },
                a1:{
                    fontSize:22,
                    align: 'center',
                    color:'#00CFFF',
                    padding:[5,0]
                },
                a2:{
                    fontSize:22,
                    align: 'center',
                    color:'#006CED',
                    padding:[5,0]
                },
                a3:{
                    fontSize:22,
                    align: 'center',
                    color:'#FFE000',
                    padding:[5,0]
                },
                b:{
                    fontSize:16,
                    align: 'center',
                    padding:[5,0]
                }
            },
        },
        formatter: function(params) {
            for (var i = 0; i < trafficWay.length; i++) {
                if (trafficWay[i].name === params) {
                    var percent = ((trafficWay[i].value / total) * 100).toFixed(0);
                    return ' {a'+ i +'|'+percent + '%}\n{hr| }\n{b|' + params+'}'
                }
            }
        }
    },
    toolbox: {
        show: false
    },
    series: seriesOption
}
尝试了以下几种方法:
1、{
trigger: ‘axis’,
axisPointer: {
type: ‘shadow’,
},
textStyle: {
color: ‘#fff’,
fontSize: 14,
}
}
2、tooltip: {
show: true,
trigger: “item”
},
3、在echarts社区图源设置
tooltip: {
show: true
},
社区上能生效,我本地代码还是不生效
最终找到原因:图例影响了它
最终解决办法:
tooltip: {
show: true,
trigger: “item”
},
并且在echarts图所在div 设置样式如下: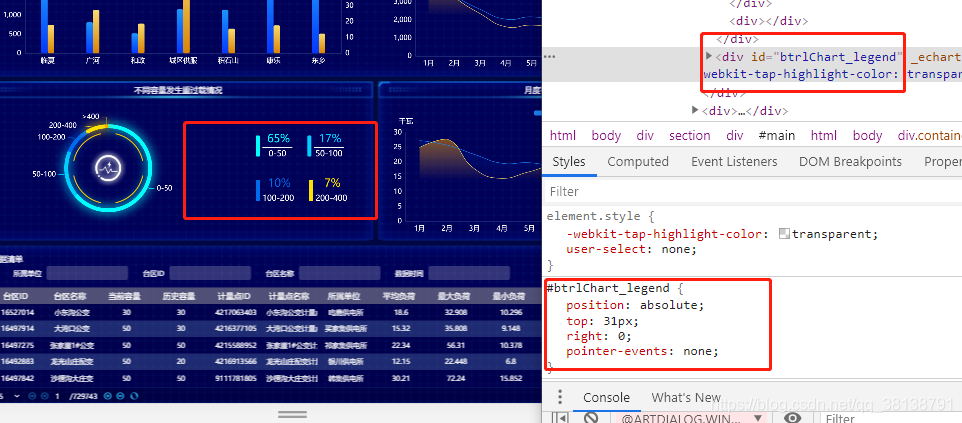
最终效果如下:
多亏了我同事前端小姐姐,默默的给她比个心❤
版权声明:本文为qq_38138791原创文章,遵循CC 4.0 BY-SA版权协议,转载请附上原文出处链接和本声明。