对于绘图,需要使用一系列值.所以,使用x = a b * i:
[a,b] = meshgrid(-10:0.1:10); %// creates two grids
ComplexValue = a+1i*b; %// get a single, complex valued grid
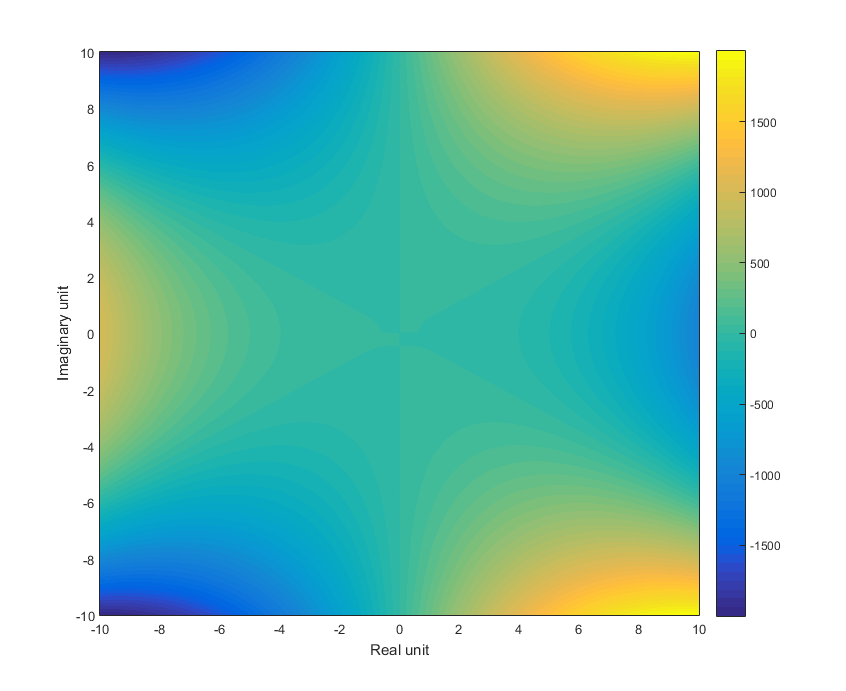
CompFun = @(x)(- real(x.^3) + imag((10 + x.*1i)./(- 100.*x.^2 + x.*5i + 20))); %// add dots for element wise calculation
result = CompFun(ComplexValue); %// get results
pcolor(a,b,result) %// plot
shading interp %// remove grid borders by interpolation
colorbar %// add colour scale
ylabel 'Imaginary unit'
xlabel 'Real unit'
我确实必须在你的等式中添加点(即元素乘法)以使其工作.
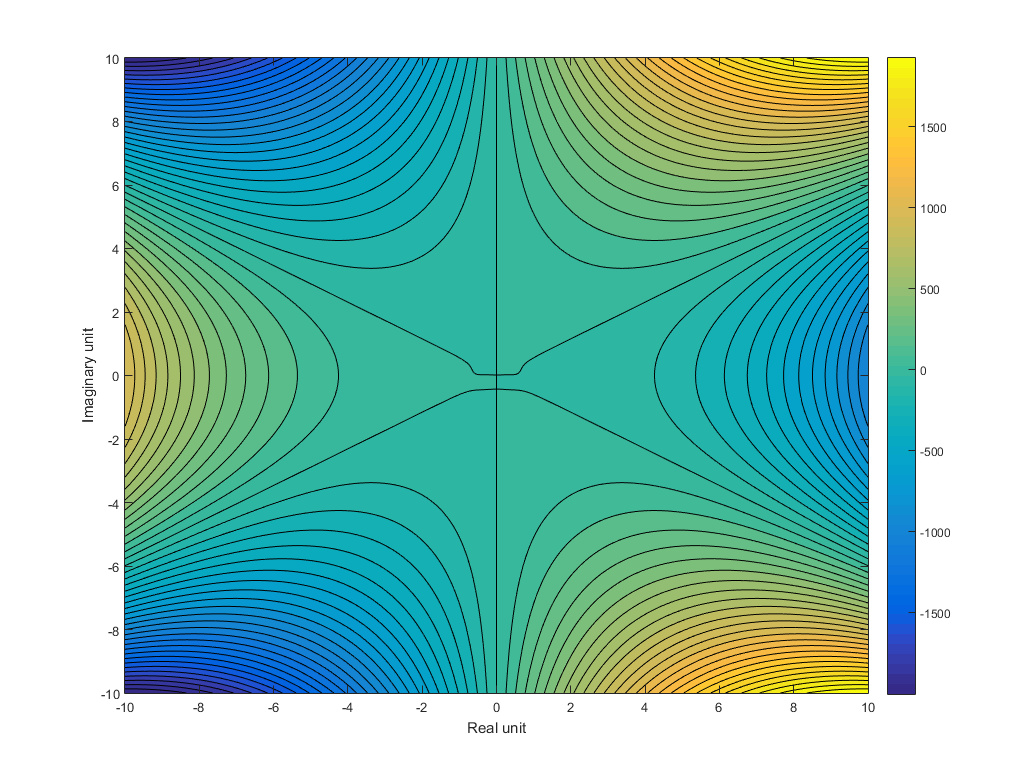
figure
contourf(a,b,result,51) %// plots with 51 contour levels
colorbar
我在这里使用-10:0.01:10的网格网格来获得更高的分辨率:
如果您不愿意手动复制解决方案以添加元素明智的乘法点,您可以求助于循环:
grid = -10:0.1:10;
result(numel(grid),numel(grid))=0; %// initialise output grid
for a = 1:numel(grid)
for b = 1:numel(grid)
x = grid(a)+1i*grid(b);
result(a,b) = ImaginaryPart(x);
end
end
这提供了相同的结果,但两者都有利有弊.它比矩阵乘法慢,即比在你的方程中添加点,但它不需要手动操作输出.