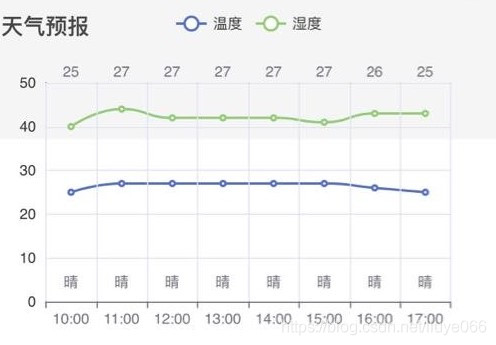
在React中使用echarts图表,制作一张24小时天气曲线图,显示温度,湿度曲线和各个小时的天气情况和具体温度;
描述:
设置了3个x轴,设置了时间,温度,天气
效果图:
1. 安装:
npm install --save echarts-for-react
npm install echarts --save
2. 在图表页面引入Echarts
import React from 'react';
import ReactEcharts from 'echarts-for-react';
3. 具体设置:
import React, {Component} from 'react';
import EChartsReact from 'echarts-for-react';

class LineChart extends Component{
    getOptions =(hours,temps, humiditys,weathers) => {
        return {
            title: {
                text: '天气预报'
            },
            tooltip: {},
            legend: {
                data: ['温度', '湿度']
            },
            // xAxis: {//单X轴
            //     data: hours,
            //     // splitLine: {
            //     //     show:true
            //     // },
            //     axisLabel: {
            //         interval:0,//代表显示所有x轴标签显示
            //         rotate:45, //代表逆时针旋转45度
            //     },
            //     axisLine: {//x轴线和标签的样式
            //         lineStyle: {
            //             color: '#333333',
            //         }
            //     },
            // },
            // 多个x轴
            xAxis: [
                {
                    data: hours,
                    splitLine: {//显示分隔线
                        show:true,
                    },
                    zlevel: 2//zlevel: 2时是底部的轴线,为1或其他数值时都是顶部的轴线
                },
                //上方的x轴
                {
                    data:temps,
                    axisLine: { //轴线不显示
                        show: false,
                    },
                    // zlevel: 1
                    position: 'top',
                    offset: -5
                },
                {
                    data:weathers,
                    axisLine: { //轴线不显示
                        show: false,
                    },
                    position:'bottom',//x轴线位置
                    offset: -30 //轴线偏移量,当position:'bottom',正值向下移,负值向上移
                }
            ],
            yAxis: {
                showLine: true,
                // axisLabel: {
                //     interval:0,//代表显示所有x轴标签显示
                //     rotate:45, //代表逆时针旋转45度
                // },
                axisLine: {//轴线和标签的样式
                    show: true,//是否显示轴线
                    lineStyle: {
                        color: '#333333',
                    }
                }
            },
            series: [{
                name: '温度',
                type: 'line',
                smooth: true,
                data: temps,
                showSymbol :true,//是否显示拐点
                // symbolSize: function (val) {
                //     return val[2] * 40;
                // },
            }, {
                name: '湿度',
                type: 'line',
                smooth: true,
                data: humiditys,
                showSymbol :true,
            }],
            dataZoom: {
                //type: 'slider':dataZoom 组件在外边。type: 'inside':看不到组件,但可拖拉查看
                type: 'inside', // 这个 dataZoom 组件是 inside 型 dataZoom 组件
                start: 0,// 左边在 10% 的位置。
                end: 30 // 右边在 60% 的位置。
            },

        };
    }
    render() {
        const {hourWeather} = this.props;
        const hours = [];
        const temps = [];
        const humiditys = [];
        const weathers = [];
        Object.keys(hourWeather).forEach((item, index)=> {
            let itemArr = item.split(' ');
            let itemStr = itemArr[1].substring(0,5);
            console.log('hourWeather',item);
            hours.push(itemStr);
            console.log('hourWeather',hourWeather[item]);
            temps.push(hourWeather[item].temp);
            humiditys.push(hourWeather[item].humidity);
            weathers.push(hourWeather[item].condition);
        });
        return (
            <div className='scrollItem'>
                <EChartsReact option={this.getOptions(hours,temps, humiditys,weathers)}/>
            </div>
        );
    }
}

export default LineChart;
版权声明:本文为liuye066原创文章,遵循CC 4.0 BY-SA版权协议,转载请附上原文出处链接和本声明。