背景:实现相应的目标检测网络需要能够测试mAP
目的:实现mAP的测试。
参考代码:https://github.com/Cartucho/mAP#create-the-ground-truth-files
目录
一、mAP概览
1.1 mAP概览
mAP为目标检测领域的基础指标。
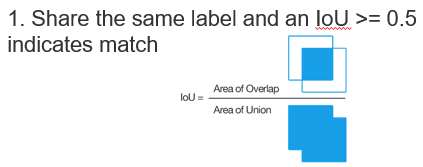
首先标签相同交并比IoU>0.5表示网络检测正确。
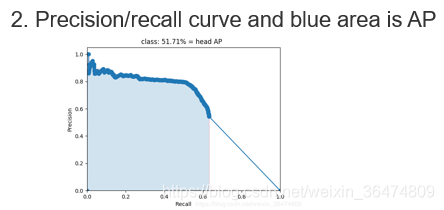
然后画出相应的查全率与查准率的曲线,积分得到的蓝色区域即为mAP。
![]()
各类的平均AP即mAP
1.2 测试需要的步骤
•Create a separate ground-truth text file for each image. In these files, each line should be in the following format:<class_name> <left> <top> <right> <bottom> [<difficult>]
生成相应的标注文档,无论是GroundTruth还是网络生成的预测,都需要按照上面的格式标注。
•Use matching names(e.g. image: "image_1.jpg", ground-truth: "image_1.txt"; "image_2.jpg", "image_2.txt"...).
然后图片放入相应的文件夹之中。
1.Create the ground-truth files创建相应的GroundTruth文件
2.Move the ground-truth files into the folderground-truth/ 放入相应文件夹
3.Create the predicted objects files 创建相应的预测的文件
4.Move the predictions files into the folderpredicted/ 放入相应文件夹
5.Run themAPcode 运行mAP的代码
二、GroundTruth文档的生成
按照要求将文件拷入文件夹与生成相应的标注。
<class_name> <left> <top> <right> <bottom> [<difficult>]标注需要与文件同名且每一行按照这种格式生成。
"""
author:xing xiangrui
time  :2018.9.26   10:34
copy image and change name to the new directory
write image name and labels to the list.txt
"""
import os
import shutil
oldDir = "data"
newDir = "head_data"
width = 352
height = 288
fw = open('list.txt','w')
for root,dirs,files in os.walk(oldDir):
    if 'images' in root:
        continue
    for file in files:
        if 'jpg' in file:
            # copy jpg
            oldPic = root + os.path.sep + file
            newPic = newDir + os.path.sep + root.split(os.path.sep)[-2] + "_" + root.split(os.path.sep)[-1] + "_" + file
            shutil.copyfile(oldPic,newPic)

            fw.write(newPic)
            # write txt
            oldTxt = root + os.path.sep + file.replace('jpg','txt')
            fo = open(oldTxt,'r')
            lines = fo.readlines()
            for line in lines:
                line = line.split()
                cx, cy, w, h = float(line[1])*width, float(line[2])*height, float(line[3])*width, float(line[4])*height
                #[x, y, w, h] = [float(line[i]) for i in range(1,5)]
                x1 = round(cx - w/2, 2)
                y1 = round(cy - h/2, 2)
                x2 = round(cx + w/2, 2)
                y2 = round(cy + h/2, 2)
                print(x1,y1,x2,y2)
                fw.write(" " + str(x1) + " " + str(y1) + " " + str(x2) + " " + str(y2))
            fw.write("\n")
            fo.close()
            #print("fine")
print("done")
fw.close()
此部分代码实现了
- 旧用于预测的图像重命名放入新目录下
- 旧标签按照mAP的要求格式生成新标签
三、网络预测结果生成
                for tmp_file in jpg_list:
                    img=cv2.imread(tmp_file)
                    # add ROI region
                    ROI=img[ROI_idx[0]:ROI_idx[1],ROI_idx[2]:ROI_idx[3]]
                    ROI_temp=ROI.copy()
                    img[:,:,:]=0
                    img[ROI_idx[0]:ROI_idx[1],ROI_idx[2]:ROI_idx[3]]=ROI_temp
                    #create txt file
                    tmp_file=tmp_file.replace("jpg","txt")
                    txt_filename=tmp_file.replace("images","predicted")
                    print("LOACTION!!!predict:"+tmp_file)

#                    start_time = time.time()
                    #print("LOCATION!!!detect_face function start"+"\n")
                    rectangles, points = detect_face(img, args.minsize,
                                                     pnet_fun, rnet_fun, onet_fun,
                                                     args.threshold, args.factor)
                    #print("LOCATION!!!idetect_face function done"+"\n")
#                    duration = time.time() - start_time

#                    print("duration:"+str(duration))
                    #print(type(rectangles))
                    points = np.transpose(points)
                    #print("LOCATION!!!loop rectangles"+"\n")
                    with open(txt_filename,'w') as result_file:
                        for rectangle in rectangles:
                            result_file.write("head" + " " + str(rectangle[4]) + " " + str(rectangle[0]) + " " + str(rectangle[1]) + " " + str(rectangle[2]) +  " " + str(rectangle[3])+"\n")
                    #print("LOCATION!!!Write done!"+"\n")
                print(ROI_idx)
                os.chdir("mAP/")
                os.system("python main.py -na")
根据网络预测将所有图片运行一遍,结果写入相应txt文件之中,然后调用mAP测试函数对结果进行预测。
四、预测mAP代码
4.1 运算IoU
      # load prediction bounding-box
      bb = [ float(x) for x in prediction["bbox"].split() ]
      for obj in ground_truth_data:
        # look for a class_name match
        if obj["class_name"] == class_name:
          bbgt = [ float(x) for x in obj["bbox"].split() ]
          bi = [max(bb[0],bbgt[0]), max(bb[1],bbgt[1]), min(bb[2],bbgt[2]), min(bb[3],bbgt[3])]
          iw = bi[2] - bi[0] + 1
          ih = bi[3] - bi[1] + 1
          if iw > 0 and ih > 0:
            # compute overlap (IoU) = area of intersection / area of union
            ua = (bb[2] - bb[0] + 1) * (bb[3] - bb[1] + 1) + (bbgt[2] - bbgt[0]
                    + 1) * (bbgt[3] - bbgt[1] + 1) - iw * ih
            ov = iw * ih / ua
            if ov > ovmax:
              ovmax = ov
              gt_match = obj
4.2 运算AP
先设置两个点,即precision为1的时候,recall为0;precision为0的时候,recall为1
def voc_ap(rec, prec):
  """
  --- Official matlab code VOC2012---
  mrec=[0 ; rec ; 1];
  mpre=[0 ; prec ; 0];
  for i=numel(mpre)-1:-1:1
      mpre(i)=max(mpre(i),mpre(i+1));
  end
  i=find(mrec(2:end)~=mrec(1:end-1))+1;
  ap=sum((mrec(i)-mrec(i-1)).*mpre(i));
  """
  rec.insert(0, 0.0) # insert 0.0 at begining of list
  rec.append(1.0) # insert 1.0 at end of list
  mrec = rec[:]
  prec.insert(0, 0.0) # insert 0.0 at begining of list
  prec.append(0.0) # insert 0.0 at end of list
  mpre = prec[:]
precision随着recall的增减,逐渐减少
  """
   This part makes the precision monotonically decreasing
    (goes from the end to the beginning)
    matlab:  for i=numel(mpre)-1:-1:1
                mpre(i)=max(mpre(i),mpre(i+1));
  """
  # matlab indexes start in 1 but python in 0, so I have to do:
  #   range(start=(len(mpre) - 2), end=0, step=-1)
  # also the python function range excludes the end, resulting in:
  #   range(start=(len(mpre) - 2), end=-1, step=-1)
  for i in range(len(mpre)-2, -1, -1):
    mpre[i] = max(mpre[i], mpre[i+1])
创建recall的变化
  """
   This part creates a list of indexes where the recall changes
    matlab:  i=find(mrec(2:end)~=mrec(1:end-1))+1;
  """
  i_list = []
  for i in range(1, len(mrec)):
    if mrec[i] != mrec[i-1]:
      i_list.append(i) # if it was matlab would be i + 1
AP即为曲线下积分的面积
  """
   The Average Precision (AP) is the area under the curve
    (numerical integration)
    matlab: ap=sum((mrec(i)-mrec(i-1)).*mpre(i));
  """
  ap = 0.0
  for i in i_list:
    ap += ((mrec[i]-mrec[i-1])*mpre[i])
  return ap, mrec, mpre
4.3 mAP
根据每类的AP算出mAP
"""
 Calculate the AP for each class
"""
sum_AP = 0.0
ap_dictionary = {}
# open file to store the results
with open(results_files_path + "/results.txt", 'w') as results_file:
  results_file.write("# AP and precision/recall per class\n")
  count_true_positives = {}
。。。代码中有大量的代码用于画出曲线和显示出ground truth和图像上的prediction等,我们省去此部分。
  results_file.write("\n# mAP of all classes\n")
  mAP = sum_AP / n_classes
  text = "mAP = {0:.2f}%".format(mAP*100)
  results_file.write(text + "\n")
  print(text)