<template>
<div>
<div id="waterSupply"></div>
</div>
</template>
<script>
import * as echarts from "echarts";
export default {
name: "waterSupply",
props: ['waterData'],
data() {
return {
xlist: [],
list: []
};
},
watch: {
// 监听
waterData(v) {
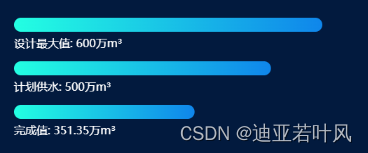
this.xlist = ["计划供水", "完成值", "设计最大值"];
// 获取数组value;
this.list = Object.values(v)
this.init();
}
},
mounted() {
},
methods: {
init() {
setTimeout(() => {
this.initWaterSupply();
}, 100);
},
initWaterSupply() {
const option = {
backgroundColor: "",
barWidth: 15,
grid: {
left: 10,
right: 50,
top: 20, //拉伸距离顶部高度
bottom: 20, //拉伸距离底部高度
containLabel: true,
},
xAxis: {
type: "value",
show: false,
splitLine: {
lineStyle: {
color: "rgba(255,255,255,0.2)",
type: "dashed",
},
},
axisTick: {
show: false,
},
axisLabel: {
// 改变x轴字体颜色和大小
textStyle: {
color: "rgba(250,250,250,0.6)",
fontSize: 16,
},
},
},
yAxis: {
type: "category",
interval: 0,
data: this.xlist,
splitLine: {
show: false,
},
axisTick: {
show: false,
},
axisLine: {
show: false,
// 改变y轴颜色
lineStyle: {
color: "#2c4054",
},
},
axisLabel: {
show: false,
formatter: '{value} m³ ', // 给y轴添加单位
textStyle: {
color: "#fff",
fontSize: 24,
},
},
},
series: [
{
type: "bar",
barWidth: 20,
itemStyle: {
normal: {
label: {
show: true,
position: [0, 30],
textStyle: {
color: "#fff",
fontSize: 16,
},
formatter: "{b}: {c}万m³",
},
color: new echarts.graphic.LinearGradient(1, 0, 0, 0, [
{
offset: 0,
color: "#0F86EB",
},
{
offset: 1,
color: "#23FFE2",
},
]),
barBorderRadius: 15,
},
},
data: this.list,
},
],
};
var waterSupply = this.$echarts.init(
document.getElementById("waterSupply")
); //图标初始化\
waterSupply.setOption(option);
window.onresize = function () {
waterSupply.resize();
};
},
},
};
</script>
<style scoped lang="scss">
#waterSupply {
width: 100%;
height: 250px;
}
</style>
版权声明:本文为smdjk33原创文章,遵循CC 4.0 BY-SA版权协议,转载请附上原文出处链接和本声明。