Latex如何编辑表格,参考链接放在最下方
在documentclass中引入package
%流程图
\usepackage{tikz}
\usetikzlibrary{arrows, shapes, chains}
\tikzstyle{startstop} = [rectangle,rounded corners, minimum width=3cm,minimum height=1cm,text centered, draw=black,fill=red!30]
\tikzstyle{io} = [trapezium, trapezium left angle = 70,trapezium right angle=110,minimum width=3cm,minimum height=1cm,text centered,draw=black,fill=blue!30]
\tikzstyle{process} = [rectangle,minimum width=3cm,minimum height=1cm,text centered,text width =3cm,draw=black,fill=orange!30]
\tikzstyle{decision} = [diamond,minimum width=3cm,minimum height=1cm,text centered,draw=black,fill=green!30]
\tikzstyle{arrow} = [thick,->,>=stealth]
在上面的设置中,可以发现起始的圆角矩形边框是黑色,背景是红色;判断的方形边框是黑色,背景是绿色;普通的矩形边框是黑色,背景是橘色。
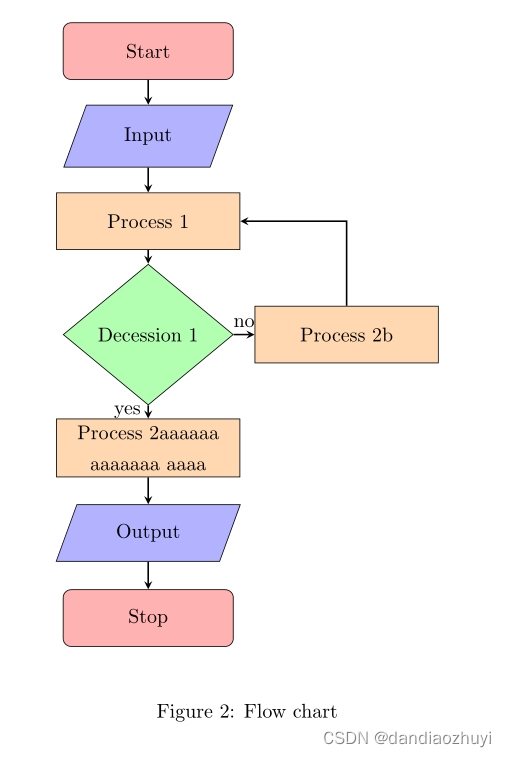
在正文中插入流程图1
\begin{figure}[!h]
\begin{center}
\begin{tikzpicture}[node distance=1.5cm]
\node (start) [startstop] {Start};
\node (input1) [io,below of=start] {Input};
\node (process1) [process,below of=input1] {Process 1};
\node (decision1) [decision,below of=process1,yshift=-0.5cm] {Decession 1};
\node (process2a) [process,below of=decision1,yshift=-0.5cm] {Process 2aaaaaa aaaaaaa aaaa};
\node (process2b) [process,right of =decision1,xshift=2cm] {Process 2b};
\node (out1) [io,below of=process2a] {Output};
\node (stop) [startstop,below of=out1] {Stop};

\draw [arrow] (start) -- (input1);
\draw [arrow] (input1) -- (process1);
\draw [arrow] (process1) -- (decision1);
\draw [arrow] (decision1) -- node[anchor=east] {yes} (process2a);
\draw [arrow] (decision1) -- node[anchor=south] {no} (process2b);
\draw [arrow] (process2b) |- (process1);
\draw [arrow] (process2a) -- (out1);
\draw [arrow] (out1) -- (stop);
\end{tikzpicture}
\end{center}
\caption{Flow chart}
\end{figure}
编译后的效果图如下:
在正文中插入流程图2
\begin{figure}[!h]
\begin{center}
\begin{tikzpicture}[node distance = 2cm]
% Place nodes
\node (start) [startstop] {Start};
\node (decP) [decision, below of = start, yshift=-0.5cm] {$p = 0$};
\node (computeLambda) [process, left of=decP, xshift=-1.5cm, yshift=-2cm] {Compute $\lambda$};
\node (computeAlpha) [process, right of=decP, xshift=2cm, yshift=-2cm, align=center] {Compute $\alpha$ and update \\ $x$ by $x = x + \alpha p$};

\node (decLambda) [decision, below of = computeLambda, yshift=-0.5cm] {$\lambda > 0$};
\node (decAlpha) [decision, below of = computeAlpha, yshift=-0.5cm] {$\alpha = 0$};

\node (DeleteConst) [process, below of=decLambda, yshift=-0.5cm] {Delete a constraint};
\node (AddConst) [process, below of=decAlpha, yshift=-0.5cm] {Add a constraint};

\node (computeP) [process, below of=start, yshift=-10cm] {Compute $p$};
\node (end) [startstop, below of=decLambda, xshift=3.5cm, yshift=-5.5cm] {Optimal};

% Draw edges
\draw [arrow] (start) -- (decP);
\draw [arrow] (decP) -| node[near start, above] {yes} (computeLambda);
\draw [arrow] (decP) -| node[near start, above] {no} (computeAlpha);

\draw [arrow](computeLambda) -- (decLambda);
\draw [arrow](computeAlpha) -- (decAlpha);

\draw [arrow] (decLambda) -- node[anchor = east] {no} (DeleteConst);
\draw [arrow] (decLambda) -- +(-2.5,0) |- node[near start, left] {yes} (end);
\draw [arrow] (decAlpha) -- node[anchor = east] {no} (AddConst);
\draw [arrow] (decAlpha) -| node[near start, above] {yes} (computeP);


\draw [arrow](DeleteConst) |- (computeP);
\draw [arrow](AddConst) |- (computeP);
\draw [arrow](computeP) -- +(0,-1.5) -- +(7,-1.5) |- (0,-0.8);

\end{tikzpicture}
\end{center}
\caption{Flow chart}
\end{figure}
编译后的效果图如下: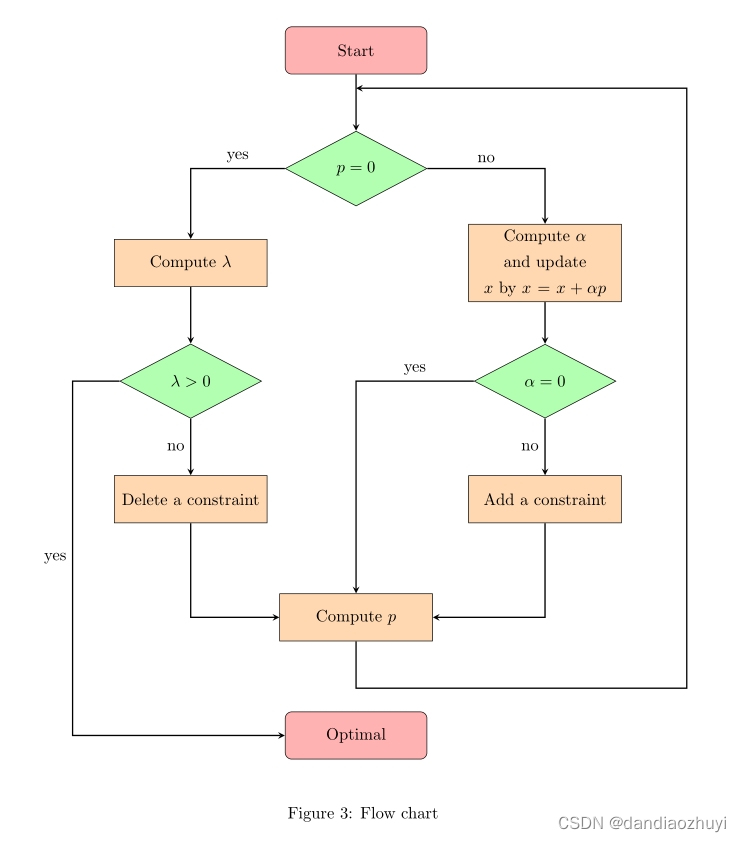
在上面的代码中,其实有绘制部分比较复杂的箭头。例如
\draw [arrow] (computeP) – +(0,-1.5) – +(7,-1.5) |- (0,-0.8);
其中坐标点(0,-1.5)、(7,-1.5)和(0,-0.8)都是以 node (computeP)来作为中心原点确定的,这里大家要注意[5]。
修改判断的方形图
\tikzstyle{decision} = [diamond, aspect = 3, text width =3cm, text centered, draw=black, fill = green!30]
当判断的方形图中的文字过长时,可以利用text width来设定文字的长度进行断句换行,也可以通过改变aspect使得方形的宽高比值发生变变化[4] 。
版权声明:本文为dandiaozhuyi原创文章,遵循CC 4.0 BY-SA版权协议,转载请附上原文出处链接和本声明。