一 点睛
通过阅读 GC 日志,我们可以了解 Java 虚拟机内存分配与回收策略。
内存分配与垃圾回收的参数列表。
-XX:+PrintGC 输出 GC 日志。类似:-verbose:gc
-XX:+PrintGCDetails 输出 GC 的详细日志。
-XX:+PrintGCTimeStamps 输出 GC 的时间戳(以基准时间的形式表示)。
-XX:+PrintGCDateStamps 输出 GC 的时间戳(以日期的形式,如2013-05-04T21:53:59.234+0800 表示)
-XX:+PrintHeapAtGC 在进行 GC 的前后打印出堆的信息。
-Xloggc:../logs/gc.1og 日志文件的输出路径。
二 verbose:gc
1 打开 GC 日志
-verbose:gc
2 仅显示总的 GC 堆的变化。

3 参数解析
三 PrintGCDetails
1 打开GC日志
-verbose:gc -XX:+PrintGCDetails
2 输出信息如下
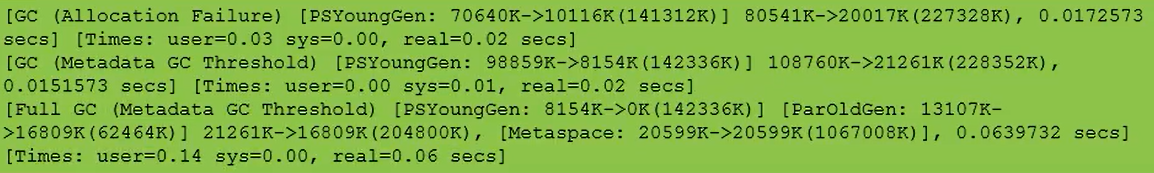
3 参数解析

四 补充
"[GC" 和 "[FullGC" 说明了这次垃圾收集的停顿类型,如果有 "Full" 则说明 GC 发生了 "stop The World"。
使用 Serial 收集器在新生代的名字是 Default New Generation,因此显示的是"[DefNew"
使用 ParNew 收集器在新生代的名字会变成 "[ParNew",意思是"Parallel New Generation"
使用 Parallel Scavenge 收集器在新生代的名字是”[PSYoungGen"
老年代的收集和新生代道理一样,名字也是收集器决定的
使用 G1 收集器的话,会显示为"garbage-first heap"
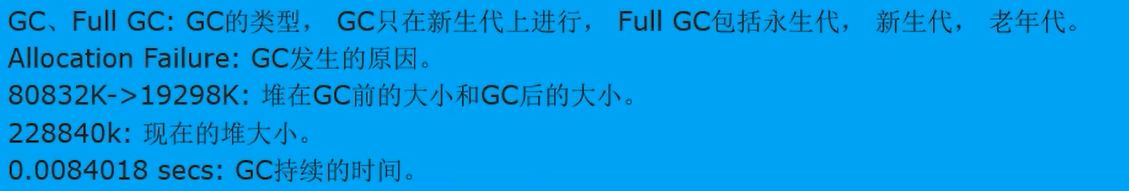
Allocation Failure 表明本次引起 GC 的原因是因为在年轻代中没有足够的空间能够存储新的数据了。
[PSYoungGen:5986K->696K(8704K)]5986K->704K(9216K)
中括号内:GC 回收前年轻代大小,回收后大小,(年轻代总大小)
括号外:GC 回收前年轻代和老年代大小,回收后大小,(年轻代和老年代总大小)
user 代表用户态回收耗时,sys 内核态回收耗时,real 实际耗时。由于多核的原因,时间总和可能会超过 real 时间
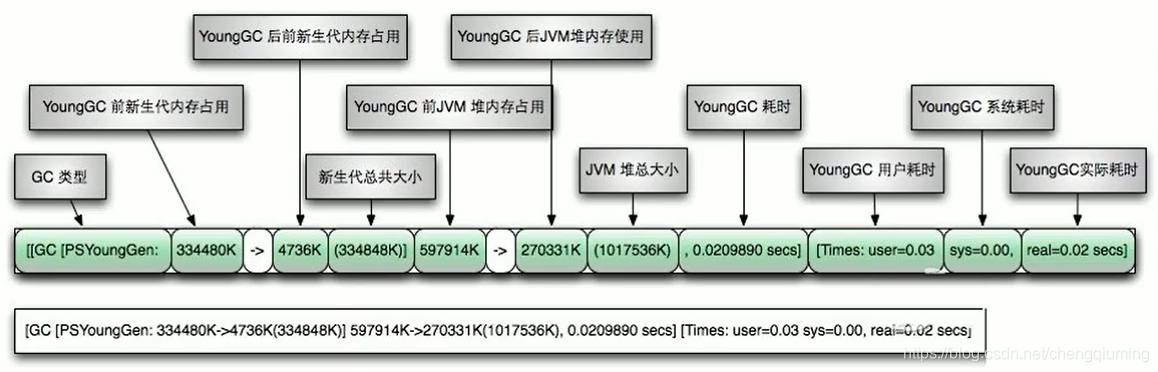
五 Young GC 图片解析
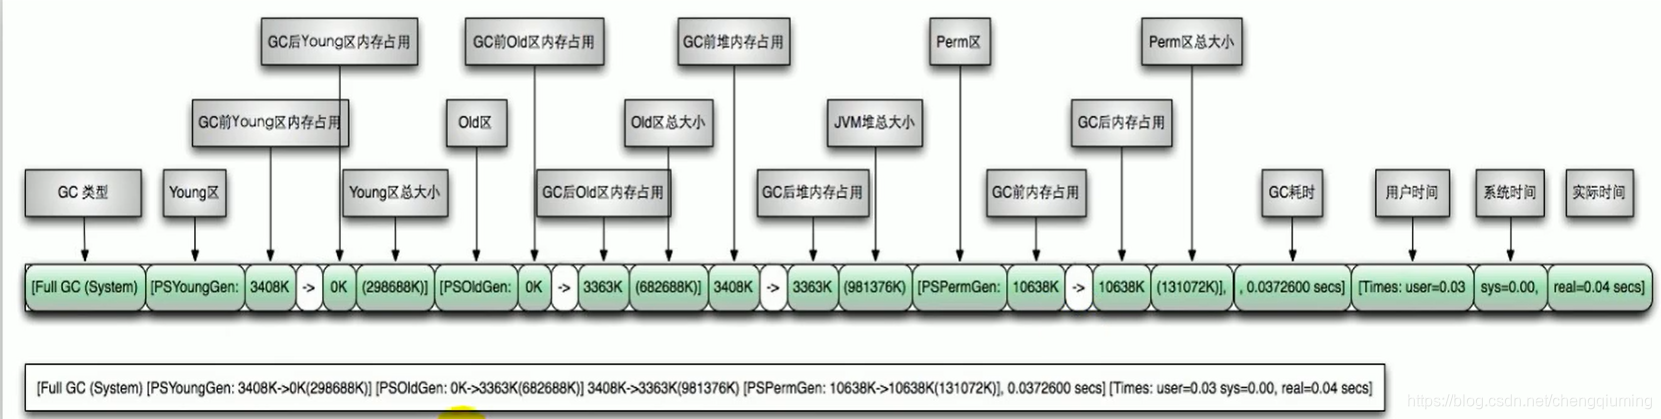
六 Full GC 图片解析
七 实战
1 代码
/**
* -Xms60m -Xmx60m -XX:+PrintGC
* -Xms60m -Xmx60m -XX:+PrintGCDetails
* -Xms60m -Xmx60m -XX:+PrintGCDetails -XX:+PrintGCTimeStamps
* -Xms60m -Xmx60m -XX:+PrintGCDetails -XX:+PrintGCDateStamps
*/
public class GCLogTest {
    public static void main(String[] args) {
        ArrayList<byte[]> list = new ArrayList<>();
        for (int i = 0; i < 500; i++) {
            byte[] arr = new byte[1024 * 100];//100KB
            list.add(arr);
        }
    }
}
2 测试——-Xms60m -Xmx60m -XX:+PrintGC
JDK 8 下的结果
[GC (Allocation Failure) 15359K->14486K(58880K), 0.0041503 secs]
[GC (Allocation Failure) 29794K->29584K(58880K), 0.0045237 secs]
[Full GC (Ergonomics) 29584K->29526K(58880K), 0.0089040 secs]
[Full GC (Ergonomics) 44822K->44429K(58880K), 0.0088807 secs]
3 测试——-Xms60m -Xmx60m -XX:+PrintGCDetails
JDK 8下的结果
[GC (Allocation Failure) [PSYoungGen: 15359K->2508K(17920K)] 15359K->14518K(58880K), 0.0052566 secs] [Times: user=0.05 sys=0.03, real=0.01 secs]
[GC (Allocation Failure) [PSYoungGen: 17817K->2536K(17920K)] 29826K->29600K(58880K), 0.0048730 secs] [Times: user=0.00 sys=0.00, real=0.01 secs]
[Full GC (Ergonomics) [PSYoungGen: 2536K->0K(17920K)] [ParOldGen: 27064K->29526K(40960K)] 29600K->29526K(58880K), [Metaspace: 3219K->3219K(1056768K)], 0.0092635 secs] [Times: user=0.09 sys=0.00, real=0.01 secs]
[Full GC (Ergonomics) [PSYoungGen: 15295K->4000K(17920K)] [ParOldGen: 29526K->40429K(40960K)] 44822K->44429K(58880K), [Metaspace: 3219K->3219K(1056768K)], 0.0048768 secs] [Times: user=0.00 sys=0.00, real=0.01 secs]
Heap
PSYoungGen total 17920K, used 10675K [0x00000000fec00000, 0x0000000100000000, 0x0000000100000000)
eden space 15360K, 69% used [0x00000000fec00000,0x00000000ff66cee8,0x00000000ffb00000)
from space 2560K, 0% used [0x00000000ffd80000,0x00000000ffd80000,0x0000000100000000)
to space 2560K, 0% used [0x00000000ffb00000,0x00000000ffb00000,0x00000000ffd80000)
ParOldGen total 40960K, used 40429K [0x00000000fc400000, 0x00000000fec00000, 0x00000000fec00000)
object space 40960K, 98% used [0x00000000fc400000,0x00000000feb7b4a0,0x00000000fec00000)
Metaspace used 3225K, capacity 4496K, committed 4864K, reserved 1056768K
class space used 348K, capacity 388K, committed 512K, reserved 1048576K
JDK 9下的结果
D:\ProgramFiles\Java\jdk-9\bin\java.exe -Xms60m -Xmx60m -XX:+PrintGCDetails -javaagent:D:\ProgramFiles\JetBrains\IDEA\lib\idea_rt.jar=58898:D:\ProgramFiles\JetBrains\IDEA\bin -Dfile.encoding=UTF-8 -classpath E:\JVMDemo\out\production\chapter17 com.atguigu.java.GCLogTest
[0.002s][warning][gc] -XX:+PrintGCDetails is deprecated. Will use -Xlog:gc* instead.
[0.026s][info ][gc,heap] Heap region size: 1M
[0.029s][info ][gc ] Using G1
[0.029s][info ][gc,heap,coops] Heap address: 0x00000000fc400000, size: 60 MB, Compressed Oops mode: 32-bit
[0.230s][info ][gc,start ] GC(0) Pause Young (G1 Evacuation Pause)
......
[0.267s][info ][gc,heap,exit ] garbage-first heap total 61440K, used 27648K [0x00000000fc400000, 0x00000000fc5001e0, 0x0000000100000000)
[0.267s][info ][gc,heap,exit ] region size 1024K, 2 young (2048K), 1 survivors (1024K)
[0.267s][info ][gc,heap,exit ] Metaspace used 5123K, capacity 5160K, committed 5376K, reserved 1056768K
[0.267s][info ][gc,heap,exit ] class space used 454K, capacity 460K, committed 512K, reserved 1048576K
4 测试——-Xms60m -Xmx60m -XX:+PrintGCDetails -XX:+PrintGCTimeStamps
JDK 8下的结果
0.150: [GC (Allocation Failure) [PSYoungGen: 15359K->2508K(17920K)] 15359K->14518K(58880K), 0.0045324 secs] [Times: user=0.05 sys=0.03, real=0.00 secs]
0.158: [GC (Allocation Failure) [PSYoungGen: 17817K->2556K(17920K)] 29826K->29592K(58880K), 0.0055471 secs] [Times: user=0.00 sys=0.00, real=0.01 secs]
0.164: [Full GC (Ergonomics) [PSYoungGen: 2556K->0K(17920K)] [ParOldGen: 27036K->29526K(40960K)] 29592K->29526K(58880K), [Metaspace: 3219K->3219K(1056768K)], 0.0092273 secs] [Times: user=0.06 sys=0.00, real=0.01 secs]
0.175: [Full GC (Ergonomics) [PSYoungGen: 15295K->4000K(17920K)] [ParOldGen: 29526K->40429K(40960K)] 44822K->44429K(58880K), [Metaspace: 3219K->3219K(1056768K)], 0.0060037 secs] [Times: user=0.00 sys=0.00, real=0.01 secs]
Heap
PSYoungGen total 17920K, used 10675K [0x00000000fec00000, 0x0000000100000000, 0x0000000100000000)
eden space 15360K, 69% used [0x00000000fec00000,0x00000000ff66cee8,0x00000000ffb00000)
from space 2560K, 0% used [0x00000000ffd80000,0x00000000ffd80000,0x0000000100000000)
to space 2560K, 0% used [0x00000000ffb00000,0x00000000ffb00000,0x00000000ffd80000)
ParOldGen total 40960K, used 40429K [0x00000000fc400000, 0x00000000fec00000, 0x00000000fec00000)
object space 40960K, 98% used [0x00000000fc400000,0x00000000feb7b4a0,0x00000000fec00000)
Metaspace used 3225K, capacity 4496K, committed 4864K, reserved 1056768K
class space used 348K, capacity 388K, committed 512K, reserved 1048576K
5 测试—— -Xms60m -Xmx60m -XX:+PrintGCDetails -XX:+PrintGCDateStamps
JDK 8下的结果
2021-07-31T16:20:43.050+0800: [GC (Allocation Failure) [PSYoungGen: 15359K->2532K(17920K)] 15359K->14430K(58880K), 0.0053418 secs] [Times: user=0.00 sys=0.00, real=0.01 secs]
2021-07-31T16:20:43.059+0800: [GC (Allocation Failure) [PSYoungGen: 17794K->2548K(17920K)] 29692K->29448K(58880K), 0.0052626 secs] [Times: user=0.00 sys=0.00, real=0.00 secs]
2021-07-31T16:20:43.065+0800: [Full GC (Ergonomics) [PSYoungGen: 2548K->0K(17920K)] [ParOldGen: 26900K->29302K(40960K)] 29448K->29302K(58880K), [Metaspace: 3219K->3219K(1056768K)], 0.0151206 secs] [Times: user=0.02 sys=0.00, real=0.01 secs]
2021-07-31T16:20:43.082+0800: [Full GC (Ergonomics) [PSYoungGen: 15343K->3500K(17920K)] [ParOldGen: 29302K->40629K(40960K)] 44646K->44129K(58880K), [Metaspace: 3219K->3219K(1056768K)], 0.0085229 secs] [Times: user=0.05 sys=0.02, real=0.01 secs]
Heap
PSYoungGen total 17920K, used 10252K [0x00000000fec00000, 0x0000000100000000, 0x0000000100000000)
eden space 15360K, 66% used [0x00000000fec00000,0x00000000ff6033c0,0x00000000ffb00000)
from space 2560K, 0% used [0x00000000ffd80000,0x00000000ffd80000,0x0000000100000000)
to space 2560K, 0% used [0x00000000ffb00000,0x00000000ffb00000,0x00000000ffd80000)
ParOldGen total 40960K, used 40629K [0x00000000fc400000, 0x00000000fec00000, 0x00000000fec00000)
object space 40960K, 99% used [0x00000000fc400000,0x00000000febad4c0,0x00000000fec00000)
Metaspace used 3225K, capacity 4496K, committed 4864K, reserved 1056768K
class space used 348K, capacity 388K, committed 512K, reserved 1048576K