
连享会-文本分析与爬虫专题研讨班
诚邀助教:连享会-文本分析与爬虫专题

这篇教程的内容比较。。。丧心病狂。旨在演示灵活组合 geojson 文件绘制复杂的区域地图。我首先是将 34 个省级的 GEOJSON 文件组合起来绘制了市级中国地图,然后又将 344 个市级的 GEOJSON 文件组合起来绘制了县级中国地图。当然绘制县级和市级中国地图的最好办法是使用之前我提供的 shp 文件。
除此之外,本文还介绍了 here 包 和 fs 包的使用,here 包可以方便的管理多个文件夹;fs 包提供了一些方便文件索引的函数。
最后我还介绍了一个新的下载 GEOJSON 数据的网址。
绘制市级中国地图
首先是导入一些需要的 R 包和设置字体:
library(geojsonsf)library(sf)library(ggplot2)library(fs)library(here)library(hrbrthemes)library(cowplot)# devtools::install_github('czxa/hotkeys')# hotkeys 是我写的一个自用的 R 包,可以用于设定快捷键,这里使用这个包里面的 `%w/o%` 操作符library(hotkeys)cnfont = "STLibianTC-Regular"enfont = "CascadiaCode-Regular"然后是将 34 个省级的 geojson 文件读取合并。
%w/o% 是放置在我编写的 hotkeys 包里面的一个函数,这个函数可以用于从某个向量里剔去指定元素,例如:
c(1, 2, 3, 4, 5) %w/o% 1## [1] 2 3 4 5dir_ls() 返回的是一个文件名向量:
setwd(here::here("d3js-geojson/china/geometryProvince"))city df ## Reading layer `71' from data source `/Users/czx/Desktop/使用 GEOJSON 文件绘制县级和市级中国地图/d3js-geojson/china/geometryProvince/71.json' using driver `GeoJSON'## Simple feature collection with 22 features and 2 fields## geometry type: MULTIPOLYGON## dimension: XY## bbox: xmin: 118.209 ymin: 21.90461 xmax: 122.0798 ymax: 26.38874## epsg (SRID): 4326## proj4string: +proj=longlat +datum=WGS84 +no_defsfor(i in city %w/o% '71.json'){ tempdf % select(id, name, geometry) df }ggplot() + geom_sf(data = df, aes(geometry = geometry, fill = factor(name)), size = 0.05, color = "white") + scale_fill_viridis_d() + theme_modern_rc(base_family = cnfont, subtitle_family = cnfont, caption_family = cnfont) + worldtilegrid::theme_enhance_wtg() + labs(title = "使用 GEOJSON 数据绘制市级中国地图", subtitle = "R Packages: geojsonsf + ggplot2 + sf", caption = "GEOJSON 数据来源:ufoe/d3js-geojson @ GitHub\n") + theme(legend.position = "none") + coord_sf(crs = "+proj=laea +lat_0=23 +lon_0=113 +x_0=4321000 +y_0=3210000 +ellps=GRS80 +units=m +no_defs")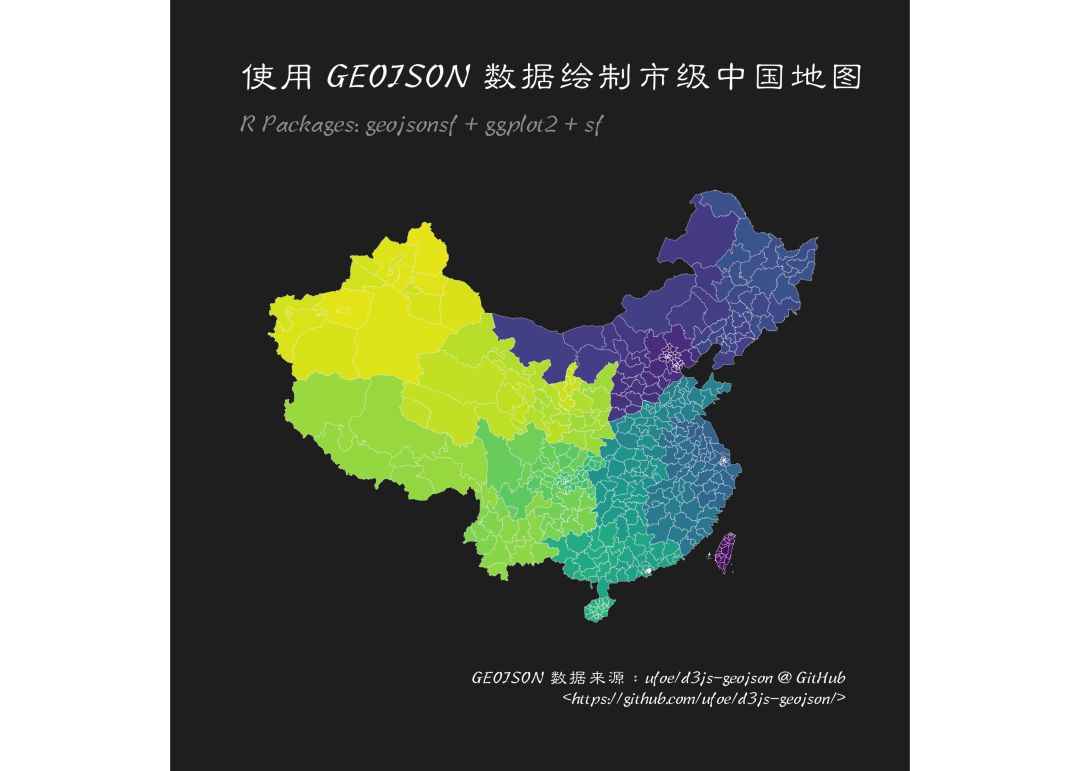
绘制县级中国地图
绘制县级中国地图的方法是一样的,只不过需要合并 344 个 geojson 文件:
setwd(here::here('d3js-geojson/china/geometryCouties'))county # 绘制市级中国地图df ## Reading layer `710000' from data source `/Users/czx/Desktop/使用 GEOJSON 文件绘制县级和市级中国地图/d3js-geojson/china/geometryCouties/710000.json' using driver `GeoJSON'## Simple feature collection with 20 features and 2 fields## geometry type: MULTIPOLYGON## dimension: XY## bbox: xmin: 119.3143 ymin: 21.88912 xmax: 123.6873 ymax: 25.93604## epsg (SRID): 4326## proj4string: +proj=longlat +datum=WGS84 +no_defsfor(i in county %w/o% '710000.json'){ tempdf % select(id, name, geometry) df }ggplot() + geom_sf(data = df, aes(geometry = geometry, fill = factor(name)), size = 0.05, color = "white") + scale_fill_viridis_d() + theme_modern_rc(base_family = cnfont, subtitle_family = cnfont, caption_family = cnfont) + worldtilegrid::theme_enhance_wtg() + theme(legend.position = "none") + coord_sf(crs = "+proj=laea +lat_0=23 +lon_0=113 +x_0=4321000 +y_0=3210000 +ellps=GRS80 +units=m +no_defs")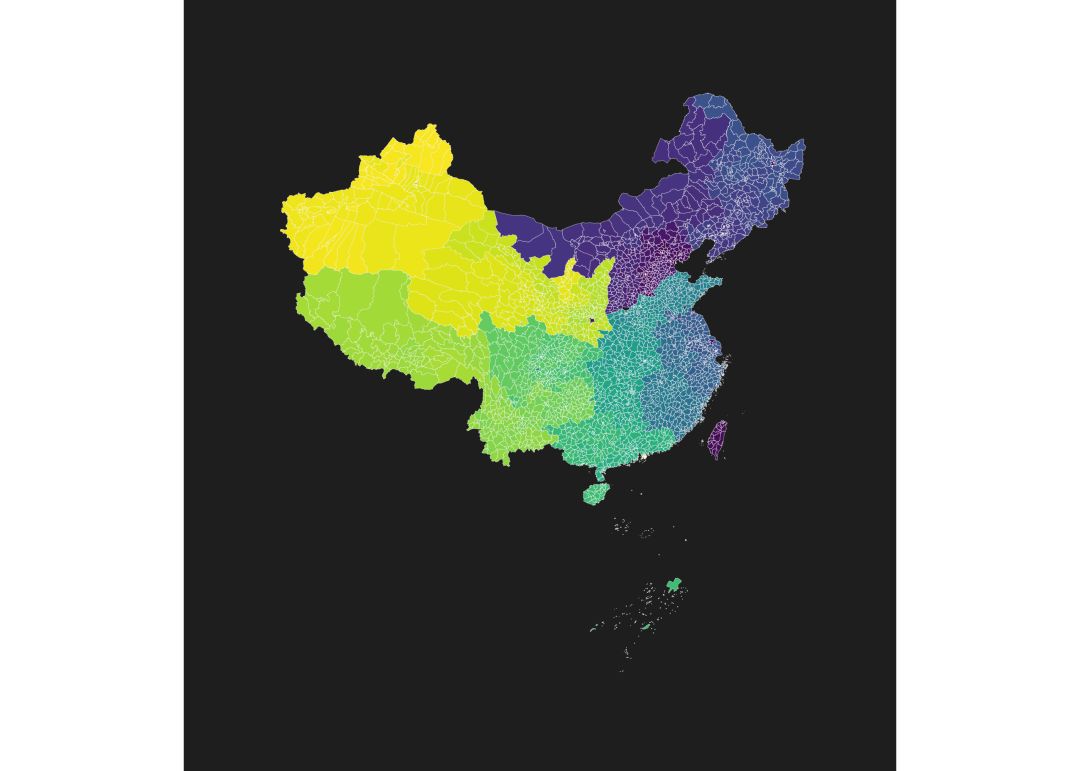
使用 shp 文件绘制市级和县级中国地图:
当然最好的办法是用我之前提供的 shp 文件:
# 市级地图setwd(here())mapdata mapborder ggplot() + geom_sf(data = mapdata, aes(geometry = geometry, fill = NAME), size = 0.05, color = "white") + geom_sf(data = mapborder, aes(geometry = geometry), size = 0.05, color = "white") + scale_fill_viridis_d() + hrbrthemes::theme_ft_rc(base_family = enfont) + worldtilegrid::theme_enhance_wtg() + theme(legend.position = "none")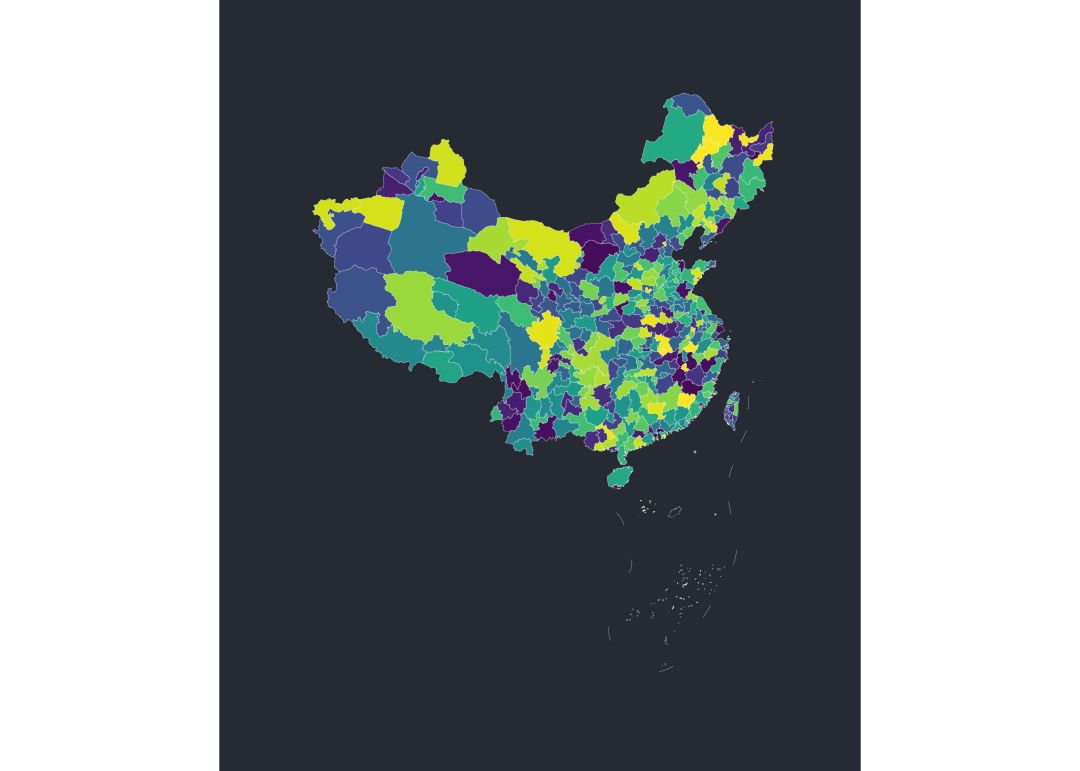
# 县级地图mapdata ggplot() + geom_sf(data = mapdata, aes(geometry = geometry, fill = NAME), size = 0.05, color = "white") + geom_sf(data = mapborder, aes(geometry = geometry), size = 0.05, color = "white") + scale_fill_viridis_d() + hrbrthemes::theme_ft_rc(base_family = enfont) + worldtilegrid::theme_enhance_wtg() + theme(legend.position = "none")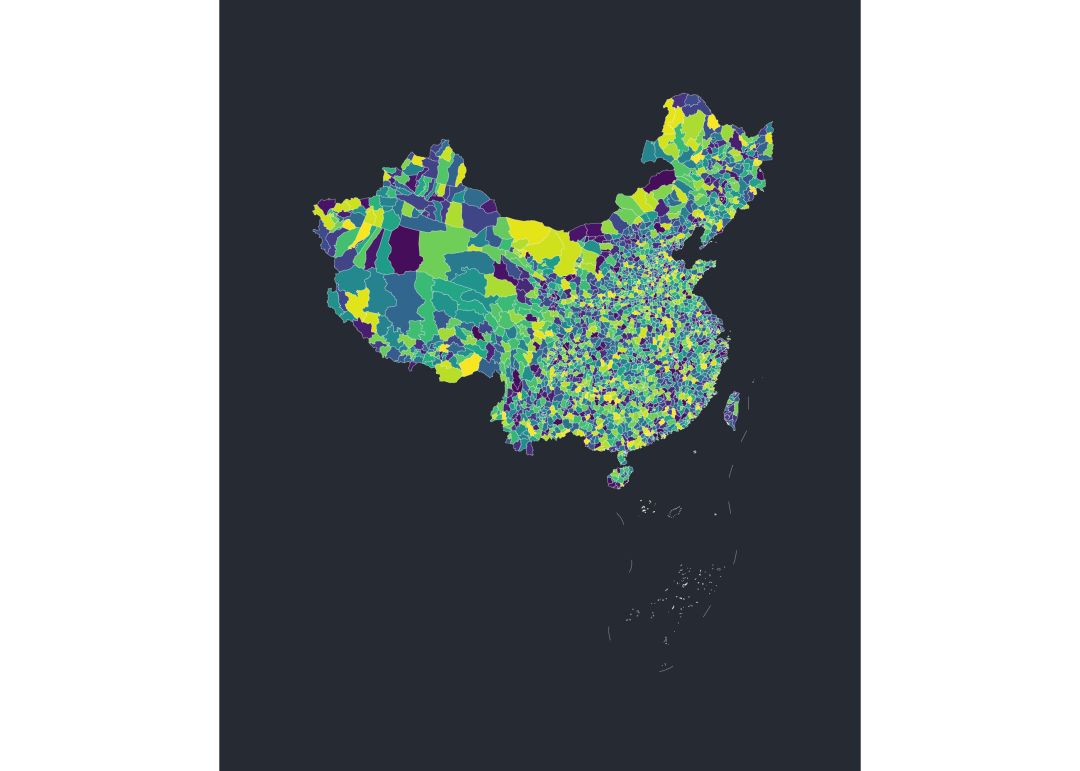
从 Highcharts 网站获取 geojson 文件
Highcharts 网站提供了大量的 geojson 文件,下载地址:https://img.hcharts.cn/mapdata/ ,例如包含巴勒斯坦地区的世界地图(高分辨率):
wdf ## Reading layer `world-palestine-highres.geo' from data source `/Users/czx/Desktop/使用 GEOJSON 文件绘制县级和市级中国地图/world-palestine-highres.geo.json' using driver `GeoJSON'## Simple feature collection with 215 features and 15 fields## geometry type: MULTIPOLYGON## dimension: XY## bbox: xmin: -999 ymin: 4669 xmax: 9851 ymax: 9851## epsg (SRID): 54003## proj4string: +proj=mill +lat_0=0 +lon_0=0 +x_0=0 +y_0=0 +R_A +datum=WGS84 +units=m +no_defsggplot() + geom_sf(data = wdf, aes(geometry = geometry, fill = name), size = 0.05, color = "white") + scale_fill_viridis_d() + hrbrthemes::theme_ft_rc(base_family = enfont) + worldtilegrid::theme_enhance_wtg() + theme(legend.position = "none")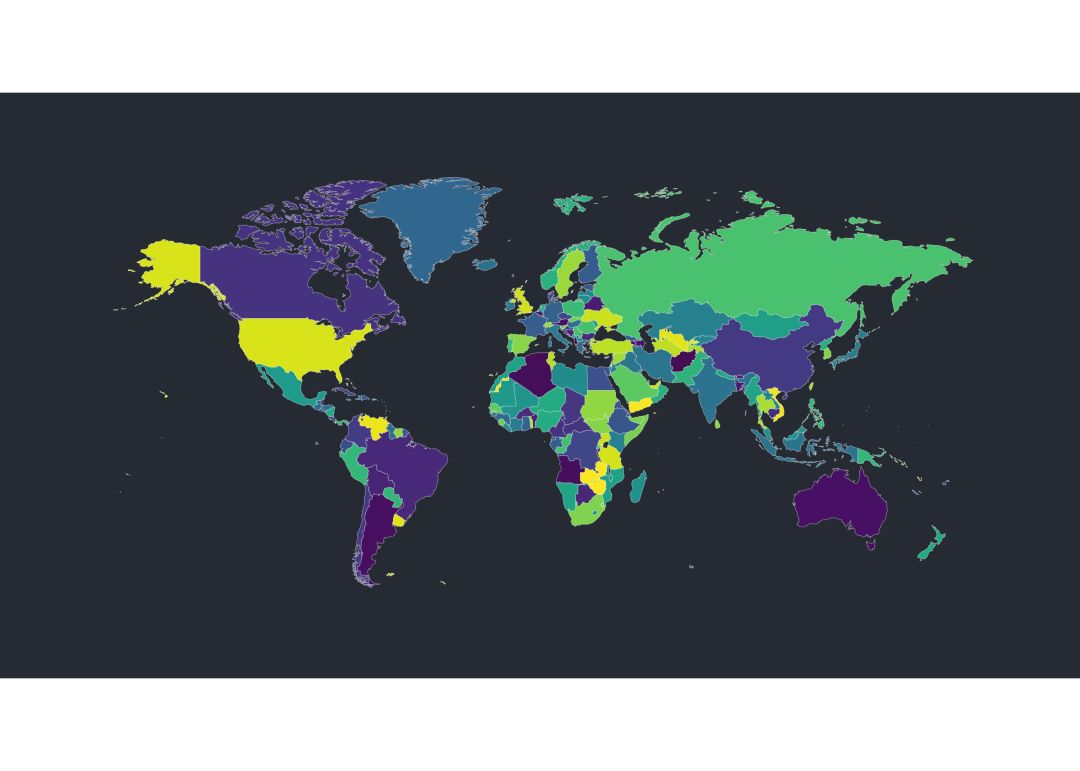
再例如中国地图:
cndf ## Reading layer `cn-all-sar-taiwan.geo' from data source `/Users/czx/Desktop/使用 GEOJSON 文件绘制县级和市级中国地图/cn-all-sar-taiwan.geo.json' using driver `GeoJSON'## Simple feature collection with 73 features and 22 fields## geometry type: MULTIPOLYGON## dimension: XY## bbox: xmin: -999 ymin: 927 xmax: 9851 ymax: 9851## epsg (SRID): 3415## proj4string: +proj=lcc +lat_1=18 +lat_2=24 +lat_0=21 +lon_0=114 +x_0=500000 +y_0=500000 +ellps=WGS72 +towgs84=0,0,1.9,0,0,0.814,-0.38 +units=m +no_defsggplot() + geom_sf(data = cndf, aes(geometry = geometry, fill = name), size = 0.05, color = "white") + scale_fill_viridis_d() + hrbrthemes::theme_ft_rc(base_family = enfont) + worldtilegrid::theme_enhance_wtg() + theme(legend.position = "none")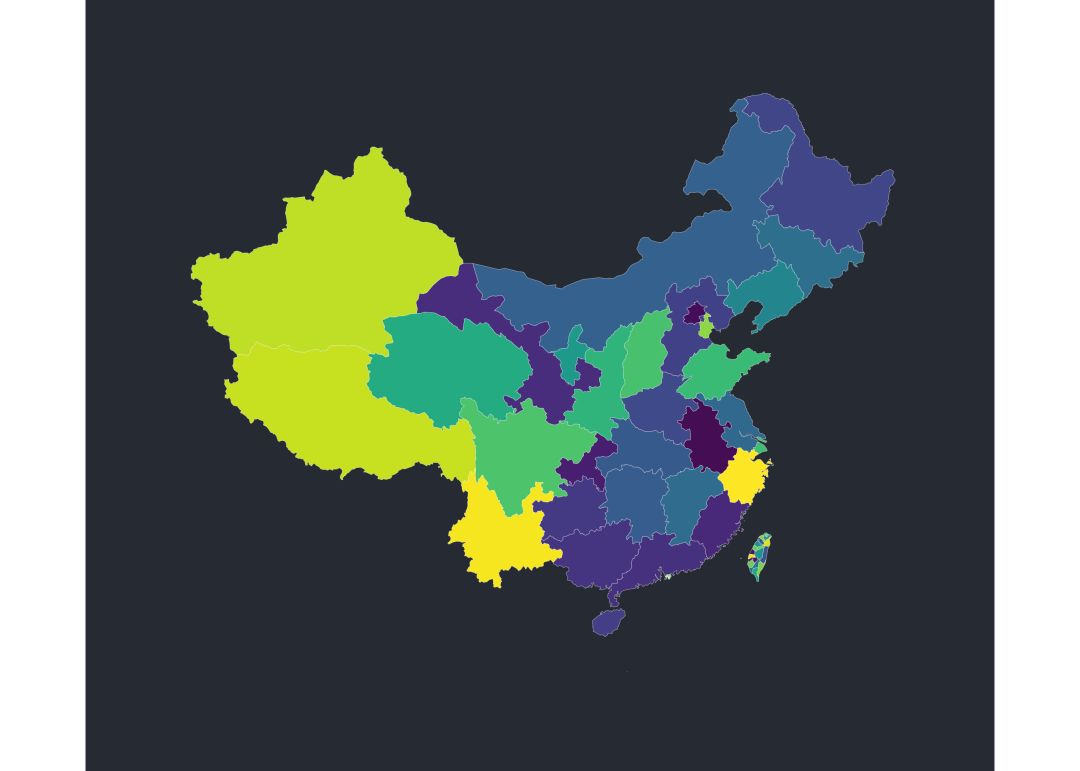
不过这个中国地图没有九段线,不是很完整(不过至今我还没有找到带有九段线的 GEOJSON 文件)。