创建于:2023.3.19
修改于:2023.3.19
1、Chi-Square Goodness of Fit Test
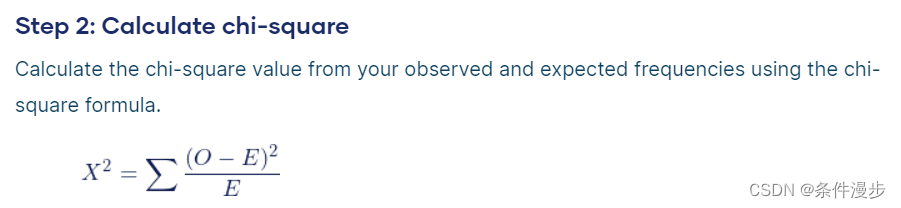
Chi-Square Goodness of Fit Test | Formula, Guide & Examples
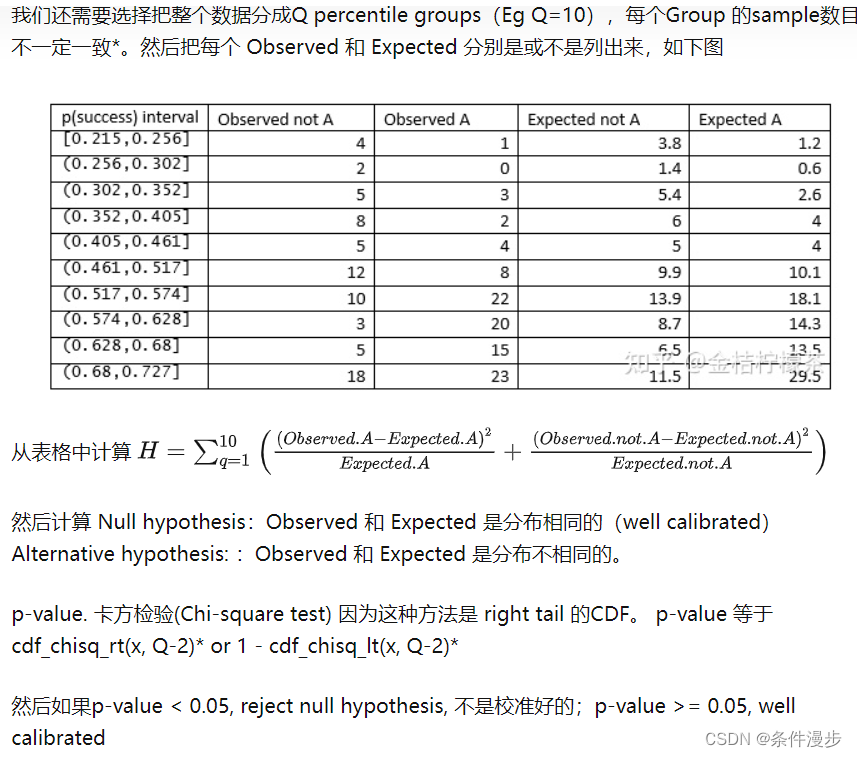
2、Hosmer–Lemeshow test 的理解以及Python代码
from scipy.stats import chi2
def Hosmer_Lemeshow_test(data, Q=10):
    '''
    data: dataframe format, with ground_truth label name is y,
                                 prediction value column name is y_hat
    '''
    data = data.sort_values('y_hat')
    data['Q_group'] = pd.qcut(data['y_hat'], Q)

    y_p = data['y'].groupby(data.Q_group).sum()
    y_total = data['y'].groupby(data.Q_group).count()
    y_n = y_total - y_p

    y_hat_p = data['y_hat'].groupby(data.Q_group).sum()
    y_hat_total = data['y_hat'].groupby(data.Q_group).count()
    y_hat_n = y_hat_total - y_hat_p

    hltest = (((y_p - y_hat_p)**2 / y_hat_p) + ((y_n - y_hat_n)**2 / y_hat_n)).sum()
    pval = 1 - chi2.cdf(hltest, Q-2)

    print('\n HL-chi2({}): {}, p-value: {}\n'.format(Q-2, hltest, pval))
    return
版权声明:本文为chenhepg原创文章,遵循CC 4.0 BY-SA版权协议,转载请附上原文出处链接和本声明。