Scikit Learn提供了一个confusion_matrix函数from sklearn.metrics import confusion_matrix
y_actu = [2, 0, 2, 2, 0, 1, 1, 2, 2, 0, 1, 2]
y_pred = [0, 0, 2, 1, 0, 2, 1, 0, 2, 0, 2, 2]
confusion_matrix(y_actu, y_pred)
输出一个Numpy数组array([[3, 0, 0],
[0, 1, 2],
[2, 1, 3]])
但也可以使用Pandas创建混淆矩阵:import pandas as pd
y_actu = pd.Series([2, 0, 2, 2, 0, 1, 1, 2, 2, 0, 1, 2], name='Actual')
y_pred = pd.Series([0, 0, 2, 1, 0, 2, 1, 0, 2, 0, 2, 2], name='Predicted')
df_confusion = pd.crosstab(y_actu, y_pred)
您将得到一个(标记良好的)Pandas数据框:Predicted 0 1 2
Actual
0 3 0 0
1 0 1 2
2 2 1 3
如果您添加margins=Truelikedf_confusion = pd.crosstab(y_actu, y_pred, rownames=['Actual'], colnames=['Predicted'], margins=True)
您还将获得每行和每列的总和:Predicted 0 1 2 All
Actual
0 3 0 0 3
1 0 1 2 3
2 2 1 3 6
All 5 2 5 12
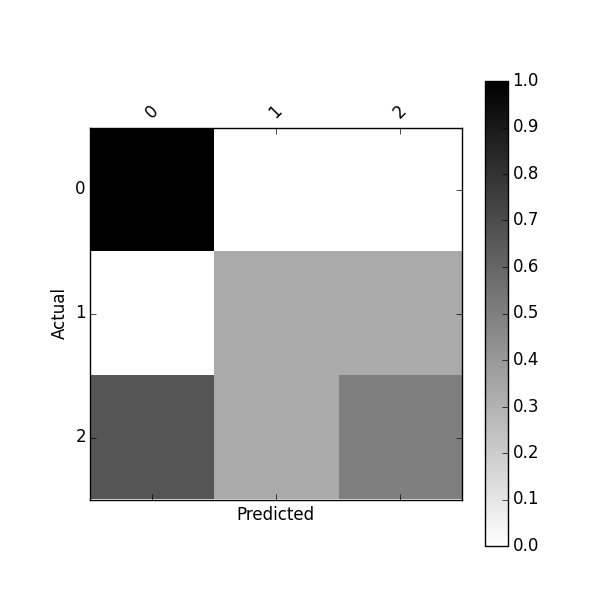
您还可以使用以下方法获得规范化的混淆矩阵:df_conf_norm = df_confusion / df_confusion.sum(axis=1)
Predicted 0 1 2
Actual
0 1.000000 0.000000 0.000000
1 0.000000 0.333333 0.333333
2 0.666667 0.333333 0.500000
您可以使用import matplotlib.pyplot as plt
def plot_confusion_matrix(df_confusion, title='Confusion matrix', cmap=plt.cm.gray_r):
plt.matshow(df_confusion, cmap=cmap) # imshow
#plt.title(title)
plt.colorbar()
tick_marks = np.arange(len(df_confusion.columns))
plt.xticks(tick_marks, df_confusion.columns, rotation=45)
plt.yticks(tick_marks, df_confusion.index)
#plt.tight_layout()
plt.ylabel(df_confusion.index.name)
plt.xlabel(df_confusion.columns.name)
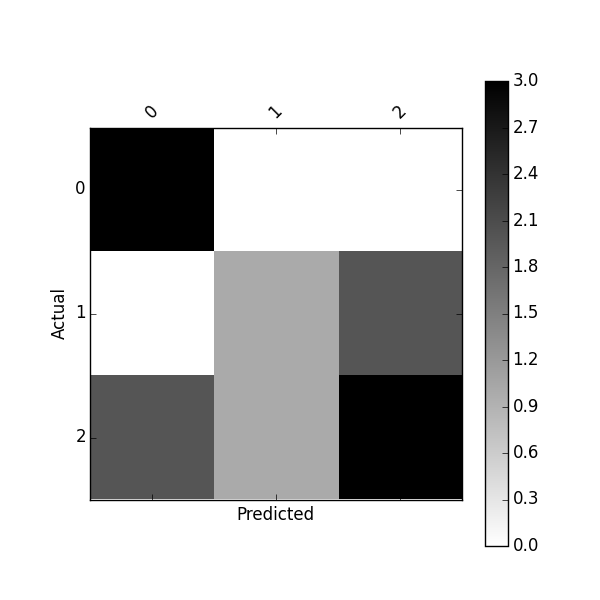
plot_confusion_matrix(df_confusion)
或使用以下方法绘制标准化混淆矩阵:plot_confusion_matrix(df_conf_norm)
用这个包混淆矩阵可以很好的打印、绘图。
可以对混淆矩阵进行二值化,获取类统计信息,如TP、TN、FP、FN、ACC、TPR、FPR、FNR、TNR(SPC)、LR+、LR-、DOR、PPV、FDR、FOR、NPV和一些总体统计信息In [1]: from pandas_ml import ConfusionMatrix
In [2]: y_actu = [2, 0, 2, 2, 0, 1, 1, 2, 2, 0, 1, 2]
In [3]: y_pred = [0, 0, 2, 1, 0, 2, 1, 0, 2, 0, 2, 2]
In [4]: cm = ConfusionMatrix(y_actu, y_pred)
In [5]: cm.print_stats()
Confusion Matrix:
Predicted 0 1 2 __all__
Actual
0 3 0 0 3
1 0 1 2 3
2 2 1 3 6
__all__ 5 2 5 12
Overall Statistics:
Accuracy: 0.583333333333
95% CI: (0.27666968568210581, 0.84834777019156982)
No Information Rate: ToDo
P-Value [Acc > NIR]: 0.189264302376
Kappa: 0.354838709677
Mcnemar's Test P-Value: ToDo
Class Statistics:
Classes 0 1 2
Population 12 12 12
P: Condition positive 3 3 6
N: Condition negative 9 9 6
Test outcome positive 5 2 5
Test outcome negative 7 10 7
TP: True Positive 3 1 3
TN: True Negative 7 8 4
FP: False Positive 2 1 2
FN: False Negative 0 2 3
TPR: (Sensitivity, hit rate, recall) 1 0.3333333 0.5
TNR=SPC: (Specificity) 0.7777778 0.8888889 0.6666667
PPV: Pos Pred Value (Precision) 0.6 0.5 0.6
NPV: Neg Pred Value 1 0.8 0.5714286
FPR: False-out 0.2222222 0.1111111 0.3333333
FDR: False Discovery Rate 0.4 0.5 0.4
FNR: Miss Rate 0 0.6666667 0.5
ACC: Accuracy 0.8333333 0.75 0.5833333
F1 score 0.75 0.4 0.5454545
MCC: Matthews correlation coefficient 0.6831301 0.2581989 0.1690309
Informedness 0.7777778 0.2222222 0.1666667
Markedness 0.6 0.3 0.1714286
Prevalence 0.25 0.25 0.5
LR+: Positive likelihood ratio 4.5 3 1.5
LR-: Negative likelihood ratio 0 0.75 0.75
DOR: Diagnostic odds ratio inf 4 2
FOR: False omission rate 0 0.2 0.4285714
我注意到一个名为PyCM的关于混淆矩阵的新Python库已经出来了:也许您可以查看一下。