Nginx virtual host traffic status module
1. VTS概述
简介
This is an Nginx module that provides access to virtual host status information. It contains the current status such as servers, upstreams, caches. This is similar to the live activity monitoring of nginx plus. The built-in html is also taken from the demo page of old version.
First of all, the directive vhost_traffic_status_zone is required, and then if the directive vhost_traffic_status_display is set, can be access to as follows:
- /status/format/json
- If you request /status/format/json, will respond with a JSON document containing the current activity data for using in live dashboards and third-party monitoring tools.
- /status/format/html
- If you request /status/format/html, will respond with the built-in live dashboard in HTML that requests internally to /status/format/json.
- /status/format/jsonp
- If you request /status/format/jsonp, will respond with a JSONP callback function containing the current activity data for using in live dashboards and third-party monitoring tools.
- /status/format/prometheus
- If you request /status/format/prometheus, will respond with a prometheus document containing the current activity data.
- /status/control
- If you request /status/control, will respond with a JSON document after it reset or delete zones through a query string. See the Control.
作用:
监控虚拟主机状态信息。可以跟prometheus结合使用,完成Nginx监控。
2. vts安装
需要携带 vts模块重新编译Nginx,并修改nginx.conf配置文件。
1. 下载nginx及nginx-module-vts
nginx: http://nginx.org/download/
vts: https://github.com/vozlt/nginx-module-vts
以nginx1.18, vts 为例:


下载后,拷贝至Linux虚拟机某目录:

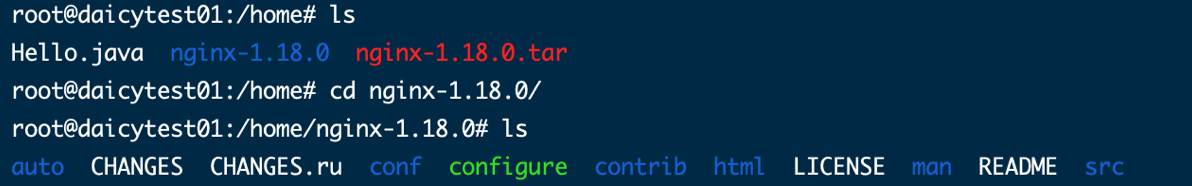
2. 解压 nginx-1.18.0.tar,nginx-module-vts-master
root@test01:/home# tar -vxf nginx-1.18.0.tar
移动nginx-module-vts文件夹至 /usr/local/
root@test01:/home# mv nginx-module-vts-master /usr/local/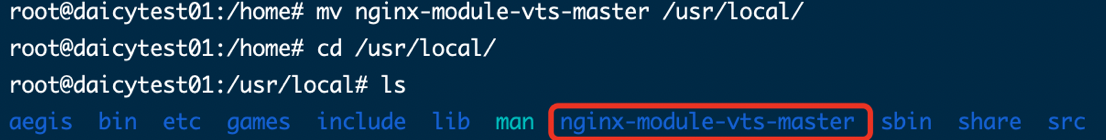
3. 安装依赖库
安装gcc g++的依赖库
sudo apt-get install build-essential
sudo apt-get install libtool

安装pcre依赖库(http://www.pcre.org/)
sudo apt-get update
sudo apt-get install libpcre3 libpcre3-dev

安装zlib依赖库(http://www.zlib.net)
sudo apt-get install zlib1g-dev

安装SSL依赖库
sudo apt-get install openssl
sudo apt-get install libssl-dev
4.安装nginx
cd /home/nginx-1.18.0

./configure  --prefix=/usr/local/nginx --with-http_gzip_static_module --with-http_stub_status_module --with-http_ssl_module --with-pcre --with-file-aio --with-http_realip_module --add-module=/usr/local/nginx-module-vts-master

make

make install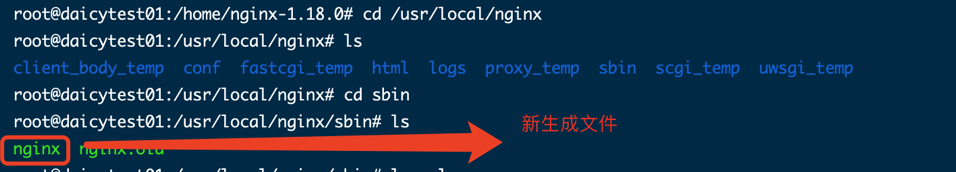
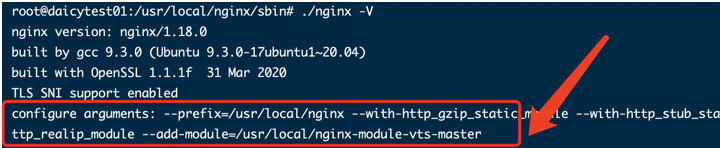
nginx -V 检查模块是否添加成功
5. 修改nginx配置文件
/usr/local/nginx/conf/nginx.conf
server下添加如下:
1 2 3 4 | location /status { vhost_traffic_status_display; vhost_traffic_status_display_format html; } |
http中添加如下
1 | vhost_traffic_status_zone; |

测试nginx配置文件是否正确
1 | /usr/local/nginx/sbin/nginx -t |
如果正确没问题,启动nginx
6. 启动nginx,测试
1 | /usr/local/nginx/sbin/nginx |
浏览器访问IP地址,查看nginx启动是否正常

访问 ip/status

至此,vts模块安装配置完成。
以下为配合Prometheus搭建监控
1. Prometheus简介
Prometheus(普罗米修斯),是一套开源的系统监控报警框架。它以给定的时间间隔从已配置的目标收集指标,评估规则表达式,显示结果,并在发现某些情况为真时触发警报。
Prometheus架构图

大致的工作流程是:
* Prometheus server 定期从配置好的 jobs 或者 exporters 中拉 metrics,或者接收来自 Pushgateway 发过来的 metrics, 或者从其他的 Prometheus server 中拉 metrics;
* Prometheus server 在本地存储收集到的 metrics,并运行已定义好的 alert.rules,记录新的时间序列或者向 Alertmanager 推送警报;
* Alertmanager 根据配置文件,对接收到的警报进行处理,发出告警;
* 在图形界面中,可视化采集数据;
2. 环境准备
2.1. 安装docker
2.2. 下载Prometheus镜像
docker pull prom/prometheus
3. 拷贝配置文件,并修改
3.1. 拷贝配置文件
3.1.1 启动prometheus
docker run prom/prometheus3.1.2 查看prometheus容器id
docker ps3.1.3 进入prometheus容器
docker exec -it 3e63f6574354 /bin/sh3.1.4 确认配置文件路径
/etc/prometheus $ cat prometheus.yml3.1.5 退出容器(exit),拷贝容器内配置文件至宿主机对应目录
docker cp 3e63f6574354:/etc/prometheus/prometheus.yml /usr/local/etc/prometheus/prometheus.yml3.2 查看宿主机ip
ifconfig

3.3 修改prometheus.yml配置文件
添加nginx监控配置
scrape_configs:
  # nginx 监控
  - job_name: 'nginx'
    metrics_path: /status/format/prometheus
    static_configs:
    - targets: ['172.17.0.1:80']

4. 删除上一个prometheus的容器实例,重启prometheus
docker ps -a
docker rm xxxxxxx
docker run \
  --name prometheus \
  -d -p 9090:9090 \
  -v /usr/local/etc/prometheus/prometheus.yml:/etc/prometheus/prometheus.yml \
  prom/prometheus \
检查是否启动成功
docker ps
5. 访问,查看nginx是否检测成功
http://xx.xx.xx.xx:9090/classic/targets

监控正常
下一篇介绍安装Grafana,用Grafana做可视化面板,更好的展示监控数据