参考链接:https://blog.csdn.net/weixin_41846769/article/details/113028800
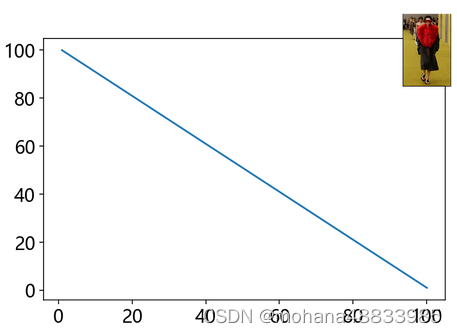
from matplotlib.offsetbox import OffsetImage,  AnnotationBbox

arr_img = plt.imread('data/ima.png')

ax = plt.plot([1,100], [100, 1])
imagebox = OffsetImage(arr_img, zoom=0.1)
# imagebox.image.axes = ax
# 使用AnnotationBbox添加到画布
ab = AnnotationBbox(imagebox, [0, 0],
                   xybox=(100, 100),
                   pad=0)
ax[0].axes.add_artist(ab)
其中不一定要加
imagebox.image.axes = ax