ELK Stack日志系统
ELK 是三个开源软件的缩写,提供一套完整的企业级日志平台解决方案。分别是:
- Elasticsearch:搜索、分析和存储数据
- Logstash :采集日志、格式化、过滤,最后将数据推送到Elasticsearch存储
- Kibana:数据可视化
- Beats :集合了多种单一用途数据采集器,用于实现从边缘机器向 Logstash 和 Elasticsearch 发送数据。里面应用最多的是Filebeat,是一个轻量级日志采集器
在每台要采集日志的服务器上面安装filebeat,filebeat是去采集该机器上面的日志文件,采集好之后推送到logstash。或者直接绕过logstash直接存储到es。然后kibana直接从es里面进行可视化日志展示(我这里使用filbeat--->elasticsearch,不使用filebeat---->logstash--->elasticsearch)
Elasticsearch部署
第一步先将es kibana搭建起来,下面先将es搭建起来
#先创建命名空间ops,日志收集的相关软件都在该命名空间下
[root@k8s-master ~]# kubectl create ns ops
namespace/ops created

[root@k8s-master ~]# mkdir -p elk
[root@k8s-master elk]# ls
elasticsearch.yaml


[root@k8s-master ~]# cat elasticsearch.yaml
apiVersion: apps/v1
kind: Deployment
metadata:
  name: elasticsearch
  namespace: ops
  labels:
    k8s-app: elasticsearch
spec:
  replicas: 1
  selector:
    matchLabels:
      k8s-app: elasticsearch
  template:
    metadata:
      labels:
        k8s-app: elasticsearch
    spec:
      containers:
      - image: elasticsearch:7.9.2
        name: elasticsearch
        resources:
          limits:
            cpu: 2
            memory: 3Gi
          requests:
            cpu: 0.5
            memory: 500Mi
        env:
          - name: "discovery.type"  #指定变量类型,为单实例,如果是集群使用有状态部署
            value: "single-node"
          - name: ES_JAVA_OPTS
            value: "-Xms512m -Xmx2g"  #JVM内存设定
        ports:
        - containerPort: 9200
          name: db
          protocol: TCP
        volumeMounts:
        - name: elasticsearch-data
          mountPath: /usr/share/elasticsearch/data
      volumes:
      - name: elasticsearch-data
        persistentVolumeClaim:
          claimName: es-pvc

---
apiVersion: v1
kind: PersistentVolumeClaim
metadata:
  name: es-pvc
  namespace: ops
spec:
  storageClassName: "managed-nfs-storage"   #采用pv的动态供给,所以集群当中要部署存储类
  accessModes:
    - ReadWriteMany
  resources:
    requests:
      storage: 10Gi

---

apiVersion: v1
kind: Service
metadata:
  name: elasticsearch
  namespace: ops
spec:
  ports:
  - port: 9200
    protocol: TCP
    targetPort: 9200
  selector:
    k8s-app: elasticsearch


#如果上面你只是自己实验环境,可以将PersistentVolumeClaim删除了,把数据持久化删除

[root@k8s-master elk]# kubectl get pod,svc -n ops
NAME                                 READY   STATUS    RESTARTS   AGE
pod/elasticsearch-67545b8fcd-pmfl4   1/1     Running   0          5m23s

NAME                    TYPE        CLUSTER-IP      EXTERNAL-IP   PORT(S)    AGE
service/elasticsearch   ClusterIP   10.103.46.115   <none>        9200/TCP   5m21s


#elasticsearch.op作为kibana去连接es的连接描述符
[root@k8s-master ~]# kubectl run -it dns-test --rm --image=busybox:1.28.4 -- sh
If you don't see a command prompt, try pressing enter.
/ # nslookup elasticsearch.ops
Server:    10.96.0.10
Address 1: 10.96.0.10 kube-dns.kube-system.svc.cluster.local

Name:      elasticsearch.ops
Address 1: 10.103.46.115 elasticsearch.ops.svc.cluster.local
Kibana部署
[root@k8s-master elk]# cat kibana.yaml
apiVersion: apps/v1
kind: Deployment
metadata:
  name: kibana
  namespace: ops
  labels:
    k8s-app: kibana
spec:
  replicas: 1
  selector:
    matchLabels:
      k8s-app: kibana
  template:
    metadata:
      labels:
        k8s-app: kibana
    spec:
      containers:
      - name: kibana
        image: kibana:7.9.2
        resources:
          limits:
            cpu: 2
            memory: 2Gi
          requests:
            cpu: 0.5
            memory: 500Mi
        env:
          - name: ELASTICSEARCH_HOSTS
            value: http://elasticsearch.ops:9200  #连接es的地址,elasticsearch.ops通过coredns解析
          - name: I18N_LOCALE  #设置中文语言
            value: zh-CN
        ports:
        - containerPort: 5601
          name: ui
          protocol: TCP

---
apiVersion: v1
kind: Service
metadata:
  name: kibana
  namespace: ops
spec:
  type: NodePort
  ports:
  - port: 5601
    protocol: TCP
    targetPort: ui    #这里引用上面定义的5601端口
    nodePort: 30601
  selector:
    k8s-app: kibana
[root@k8s-master elk]# kubectl get pod,svc -n ops
NAME READY STATUS RESTARTS AGE
pod/elasticsearch-67545b8fcd-pmfl4 1/1 Running 0 28m
pod/kibana-55c8979979-vlk2m 1/1 Running 0 13m
NAME TYPE CLUSTER-IP EXTERNAL-IP PORT(S) AGE
service/elasticsearch ClusterIP 10.103.46.115 <none> 9200/TCP 28m
service/kibana NodePort 10.99.54.222 <none> 5601:30601/TCP 13m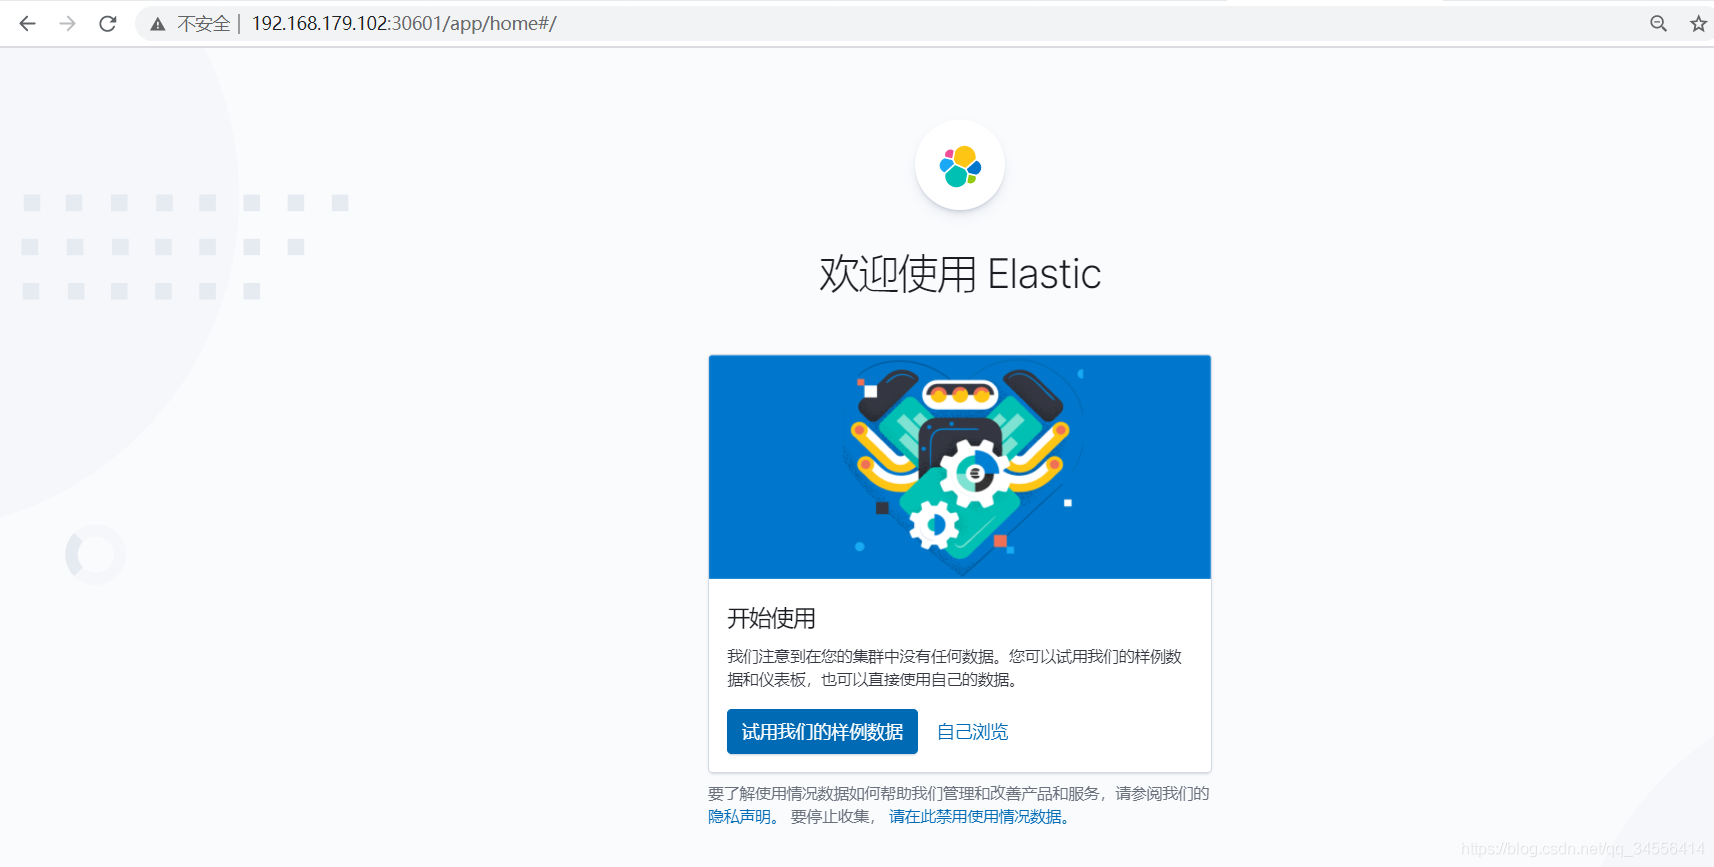
上面两个步骤就将elasticsearch和kiabana平台部署起来了,下面就要使用deamonset去部署filebeat去收集每个节点日志(以DaemonSet方式在每个Node上部署一个日志收集程序,采集 /var/lib/docker/containers/目录下所有容器日志)
Filebeat部署
[root@k8s-master elk]# cat filebeat-kubernetes.yaml
---
apiVersion: v1
kind: ConfigMap
metadata:
  name: filebeat-config
  namespace: ops
  labels:
    k8s-app: filebeat
data:
  filebeat.yml: |-
    filebeat.config:
      inputs:
        # Mounted `filebeat-inputs` configmap:
        path: ${path.config}/inputs.d/*.yml
        # Reload inputs configs as they change:
        reload.enabled: false
      modules:
        path: ${path.config}/modules.d/*.yml
        # Reload module configs as they change:
        reload.enabled: false

    output.elasticsearch:
      hosts: ['elasticsearch.ops:9200']
---
#下面是针对k8s的配置,日志类型为docker。这里要启动filebeat内置对docker的支持基于docker采集日志,并且对日志进行处理
apiVersion: v1
kind: ConfigMap
metadata:
  name: filebeat-inputs
  namespace: ops
  labels:
    k8s-app: filebeat
data:
  kubernetes.yml: |-
    - type: docker
      containers.ids:
      - "*"
      processors:
        - add_kubernetes_metadata:
            in_cluster: true
---
apiVersion: apps/v1
kind: DaemonSet
metadata:
  name: filebeat
  namespace: ops
  labels:
    k8s-app: filebeat
spec:
  selector:
    matchLabels:
      k8s-app: filebeat
  template:
    metadata:
      labels:
        k8s-app: filebeat
    spec:
      serviceAccountName: filebeat
      terminationGracePeriodSeconds: 30
      containers:
      - name: filebeat
        image: elastic/filebeat:7.9.2
        args: [
          "-c", "/etc/filebeat.yml",
          "-e",
        ]
        securityContext:
          runAsUser: 0
          # If using Red Hat OpenShift uncomment this:
          #privileged: true
        resources:
          limits:
            memory: 200Mi
          requests:
            cpu: 100m
            memory: 100Mi
        volumeMounts:
        - name: config
          mountPath: /etc/filebeat.yml
          readOnly: true
          subPath: filebeat.yml
        - name: inputs
          mountPath: /usr/share/filebeat/inputs.d
          readOnly: true
        - name: data
          mountPath: /usr/share/filebeat/data
        - name: varlibdockercontainers
          mountPath: /var/lib/docker/containers
          readOnly: true
      volumes:
      - name: config
        configMap:
          defaultMode: 0600
          name: filebeat-config
      - name: varlibdockercontainers
        hostPath:
          path: /var/lib/docker/containers
      - name: inputs
        configMap:
          defaultMode: 0600
          name: filebeat-inputs
      # data folder stores a registry of read status for all files, so we don't send everything again on a Filebeat pod restart
      - name: data
        hostPath:
          path: /var/lib/filebeat-data
          type: DirectoryOrCreate
---
apiVersion: rbac.authorization.k8s.io/v1
kind: ClusterRoleBinding
metadata:
  name: filebeat
subjects:
- kind: ServiceAccount
  name: filebeat
  namespace: ops
roleRef:
  kind: ClusterRole
  name: filebeat
  apiGroup: rbac.authorization.k8s.io
---
apiVersion: rbac.authorization.k8s.io/v1
kind: ClusterRole
metadata:
  name: filebeat
  labels:
    k8s-app: filebeat
rules:
- apiGroups: [""] # "" indicates the core API group
  resources:
  - namespaces
  - pods
  verbs:
  - get
  - watch
  - list
---
apiVersion: v1
kind: ServiceAccount
metadata:
  name: filebeat
  namespace: ops
  labels:
    k8s-app: filebeat


data:
  kubernetes.yml: |-
    - type: docker
      containers.ids:
      - "*"
      processors:
        - add_kubernetes_metadata:
            in_cluster: true
#内置对kubernetes的支持,从k8s中获取采集日志的信息,比如标签,命名空间


#现在要部署fileat采集所有容器的标准输出,使用configmap做配置存储,使用hostpath将宿主机日志目录挂载,这样filebeat就可以读取到宿主机上面的目录了
      - name: varlibdockercontainers
        hostPath:
          path: /var/lib/docker/containers

[root@k8s-master elk]# kubectl apply -f filebeat-kubernetes.yaml
configmap/filebeat-config created
configmap/filebeat-inputs created
daemonset.apps/filebeat created
clusterrolebinding.rbac.authorization.k8s.io/filebeat created
clusterrole.rbac.authorization.k8s.io/filebeat created
serviceaccount/filebeat created

[root@k8s-master elk]# kubectl get pod  -l k8s-app=filebeat -n ops -o wide
NAME             READY   STATUS    RESTARTS   AGE    IP               NODE        NOMINATED NODE   READINESS GATES
filebeat-q5gch   1/1     Running   0          2m1s   10.244.36.78     k8s-node1   <none>           <none>
filebeat-sfzgg   1/1     Running   0          68s    10.244.169.142   k8s-node2   <none>           <none>
当部署好filebeat部署好之后就可以去采集这个目录下的日志了,只要filebeat能够连接到es就可以写入数据
[root@k8s-master elk]# kubectl exec -it filebeat-sfzgg -n ops -- sh
sh-4.2# ls /var/lib/docker/containers
01e8a96a871cfbb5f37babe1e39b5f7e313a9e39edd69304389f8f7592d5c06c
0db974974bb446c83dbea186f063f50a3e4881dfb52538700055455ab13794fe
157e5ded52dbdcae4f9a2a1282088cbde4b4b3bc099765de09589c73919cd7a0
1cc7875a061a9673c92ecdb187a9fe48b0bb0001176e89d5ddb1955a83f3dc24
356d96d52f199c4ebba8d63888e6fa730c9583803057365e750a9af4fb2d4fe5
36c35f3913e880b6ee08ec898c7230113bd10eb65afb115aceaaf3abc5489b2e
3ab20de4bb389a4cf9547bd7114bf429c296f05b4054ddd56f6c86a3bfd720ff
部署成功之后就开始去采集指定目录下面的所有文件了
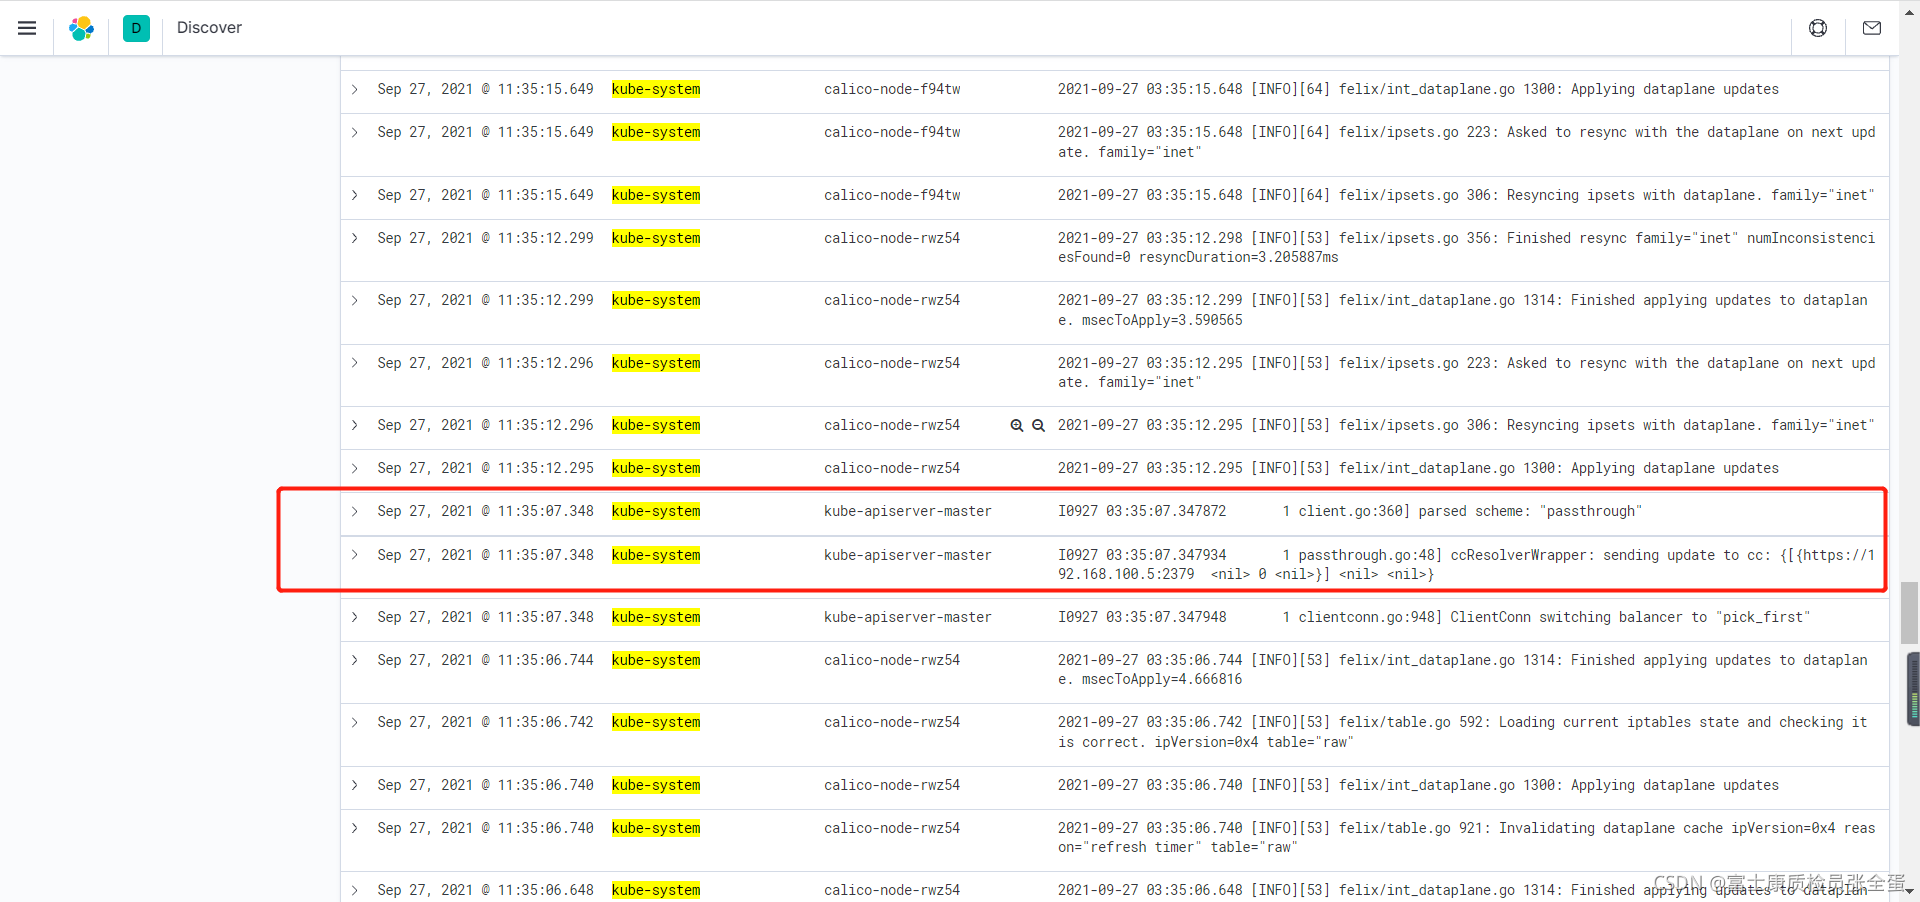
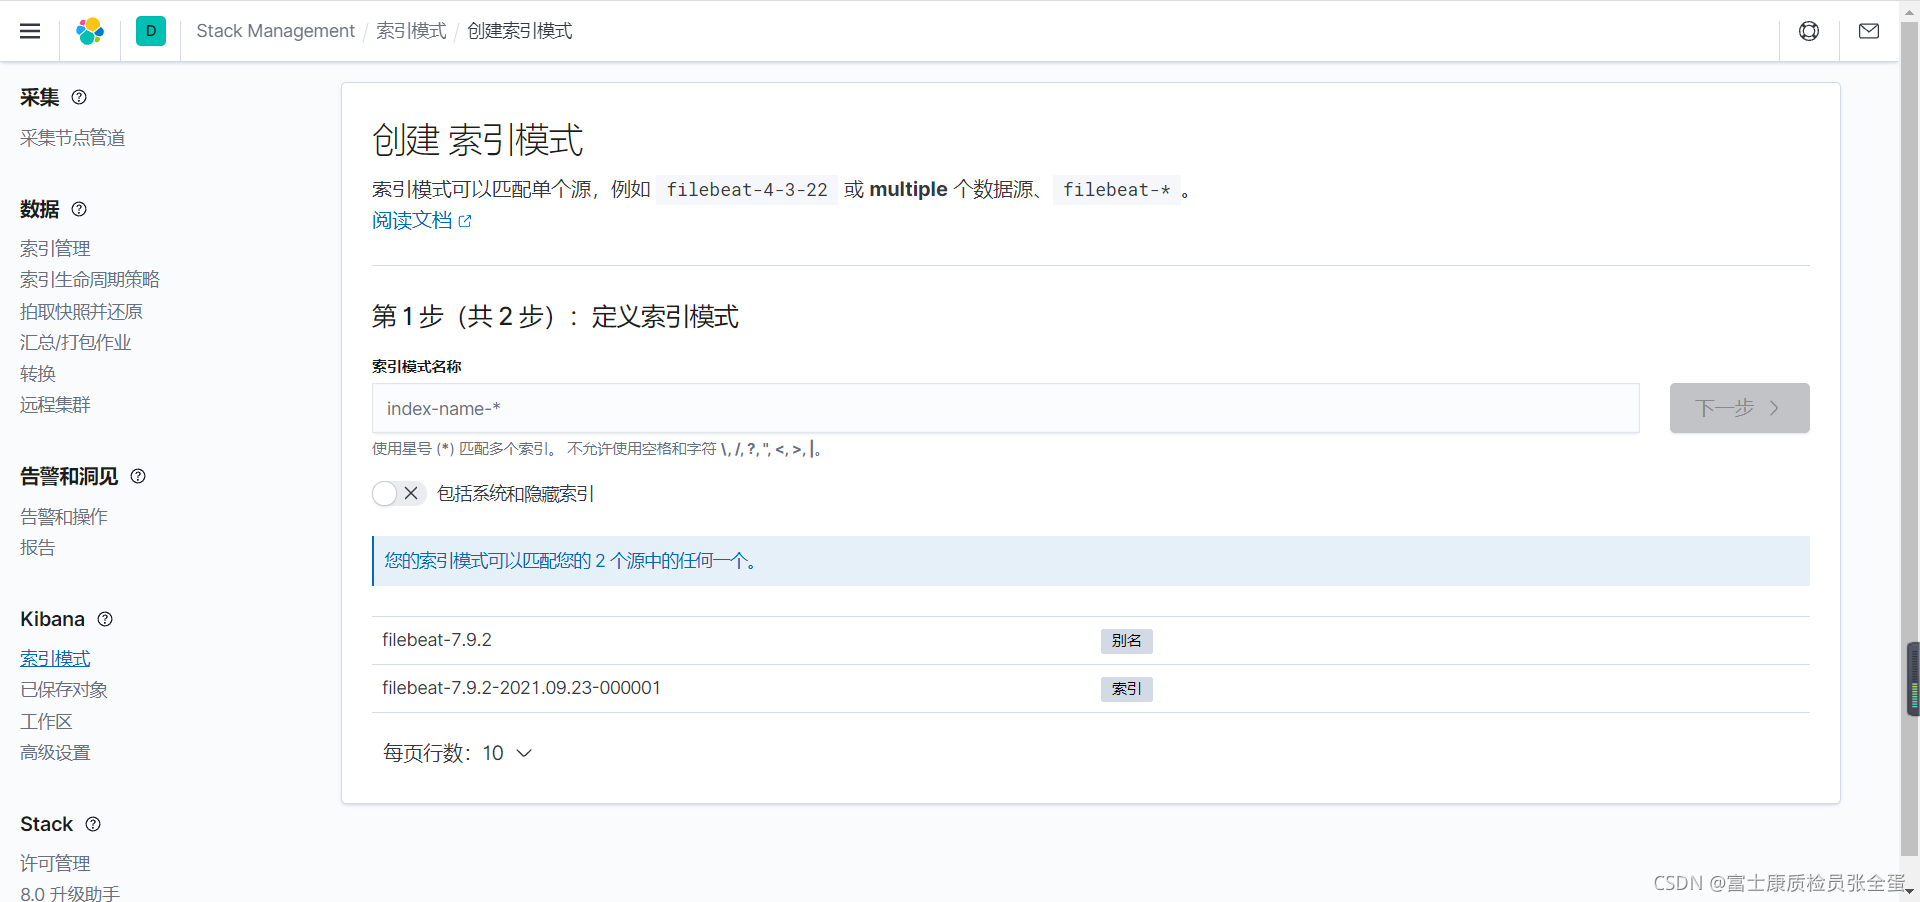
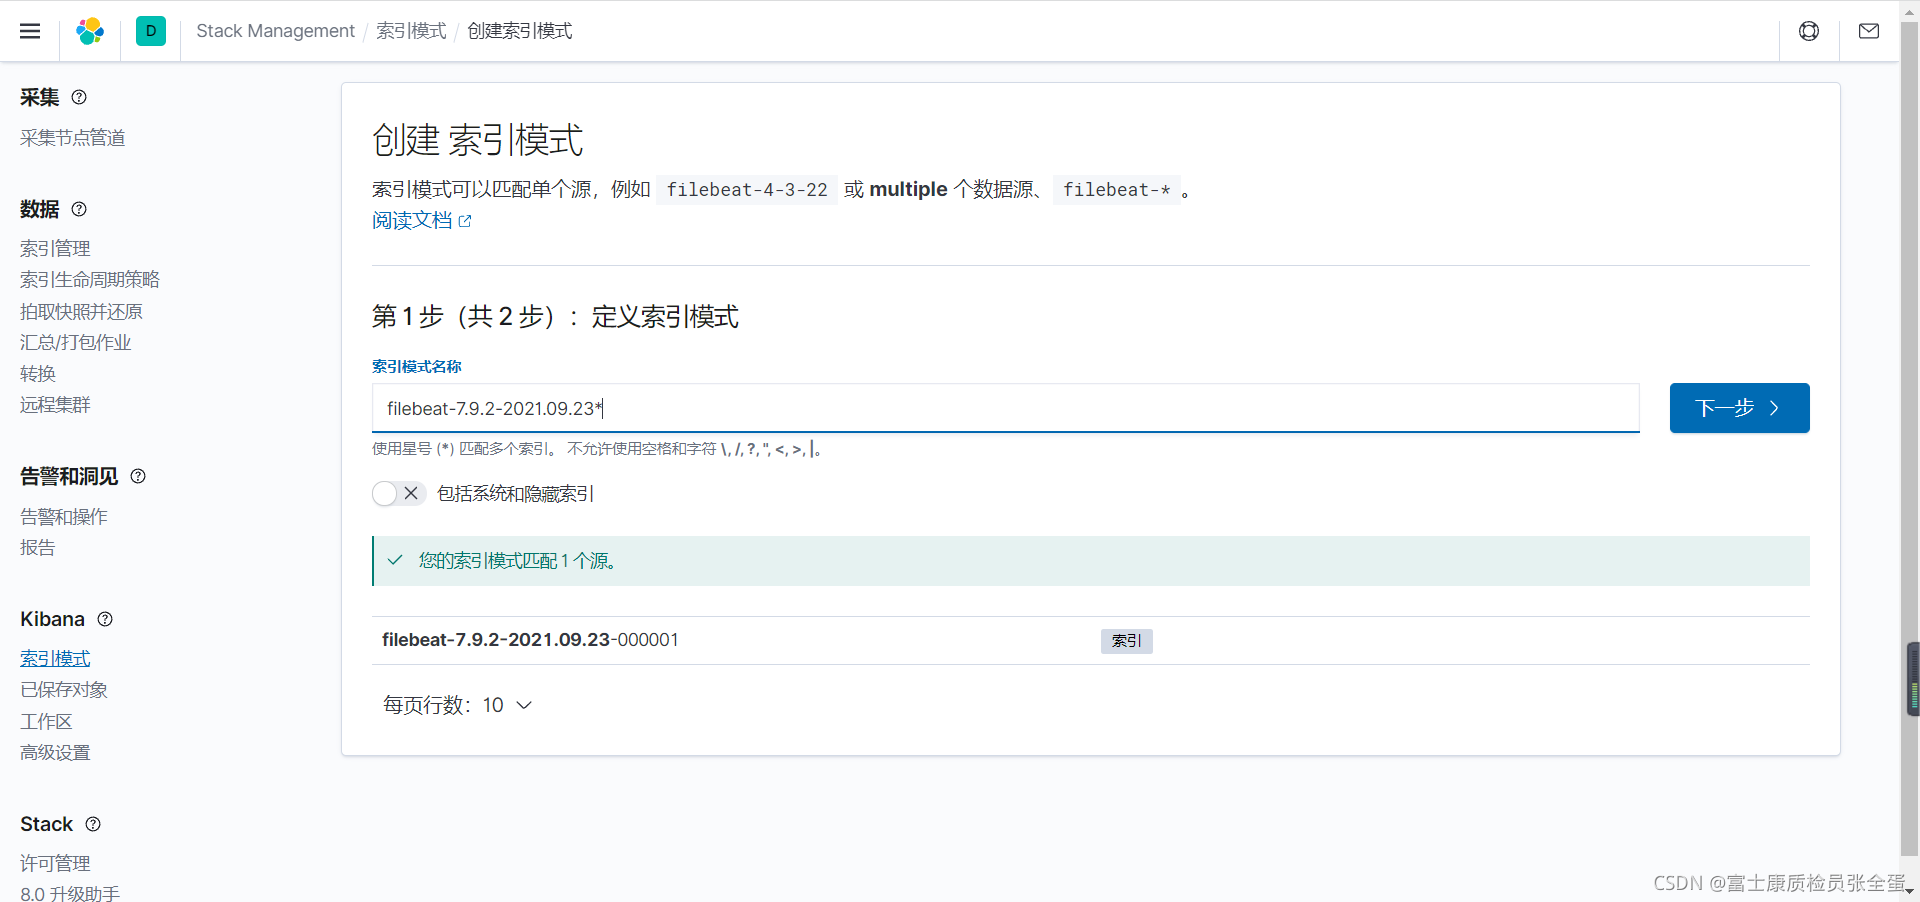
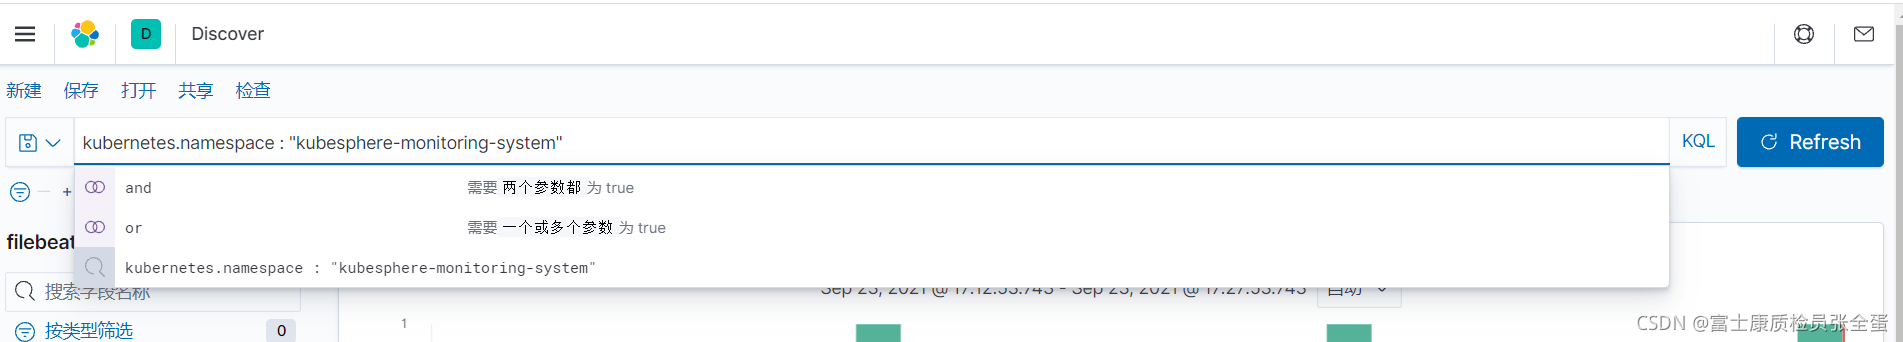
kibana展示
基于这个索引可以创建月份的
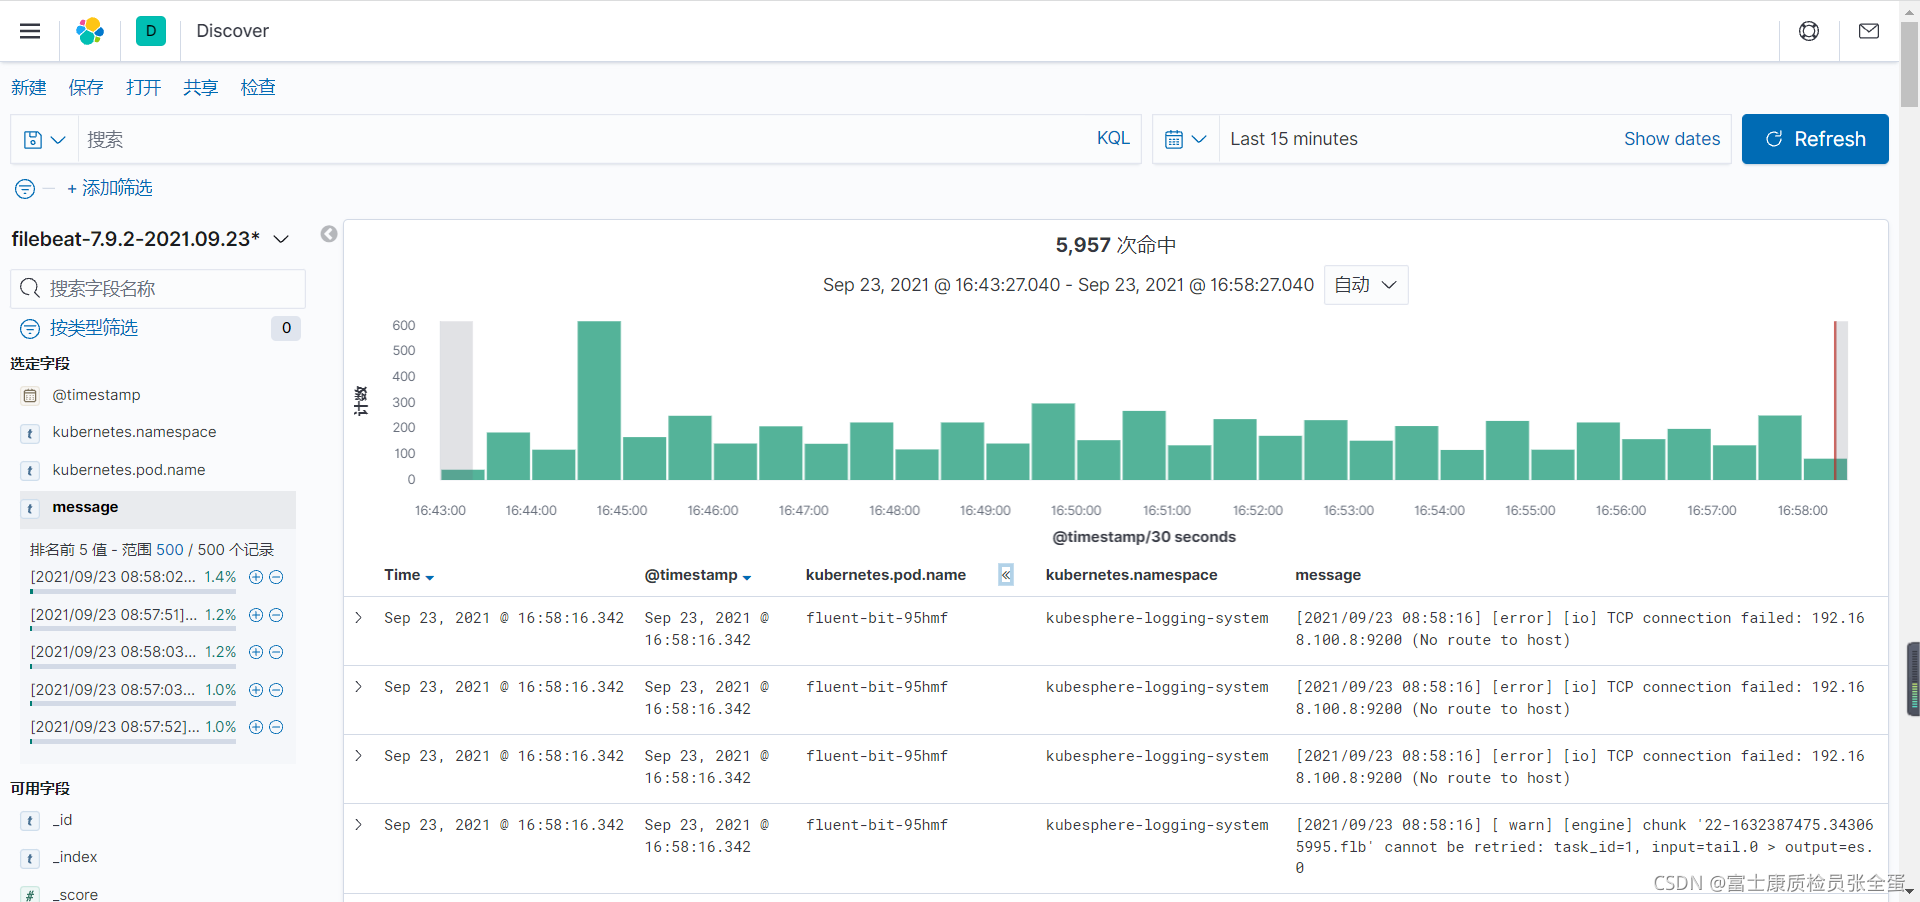
[root@master ~]# kubectl get pod -n kubesphere-logging-system
NAME                                          READY   STATUS    RESTARTS   AGE
fluent-bit-95hmf                              1/1     Running   0          41m
fluent-bit-hczn6                              1/1     Running   0          41m
fluent-bit-qkw5s                              1/1     Running   0          41m
fluentbit-operator-5576bbdcff-ckdlm           1/1     Running   0          41m
logsidecar-injector-deploy-5b484f575d-f5qh6   2/2     Running   0          41m
logsidecar-injector-deploy-5b484f575d-l4292   2/2     Running   0          41m
可以看到fluent-bit的日志采集到了,并且日志报错无法连接到外部的es
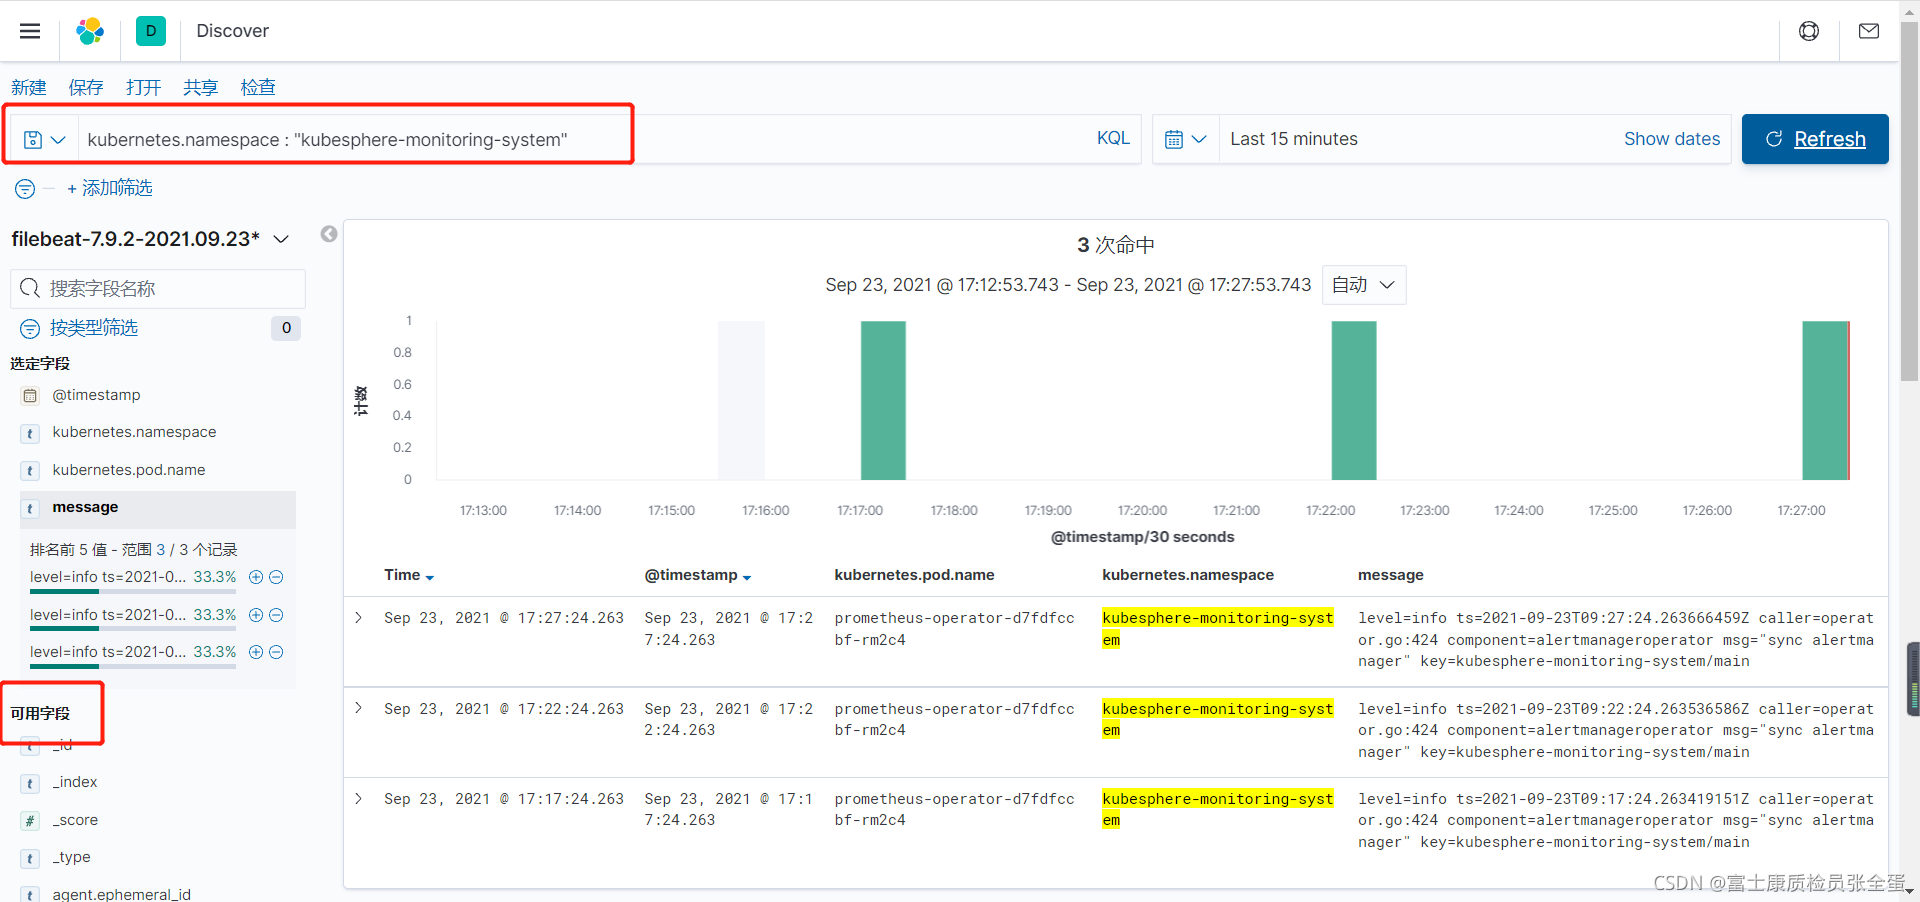
同时可以基于字段去刷选过滤出想要的信息
现在创建一个标准输出的pod
[root@master elk]# cat app-log-stdout.yaml
apiVersion: apps/v1
kind: Deployment
metadata:
name: app-log-stdout
spec:
replicas: 1
selector:
matchLabels:
project: microservice
app: nginx-stdout
template:
metadata:
labels:
project: microservice
app: nginx-stdout
spec:
containers:
- name: nginx
image: nginx
---
apiVersion: v1
kind: Service
metadata:
name: app-log-stdout
spec:
ports:
- port: 80
protocol: TCP
targetPort: 80
selector:
project: microservice
app: nginx-stdout
[root@master elk]# kubectl get pod,svc
NAME READY STATUS RESTARTS AGE
pod/app-log-stdout-584c76c5d-7wz2z 1/1 Running 0 14m
NAME TYPE CLUSTER-IP EXTERNAL-IP PORT(S) AGE
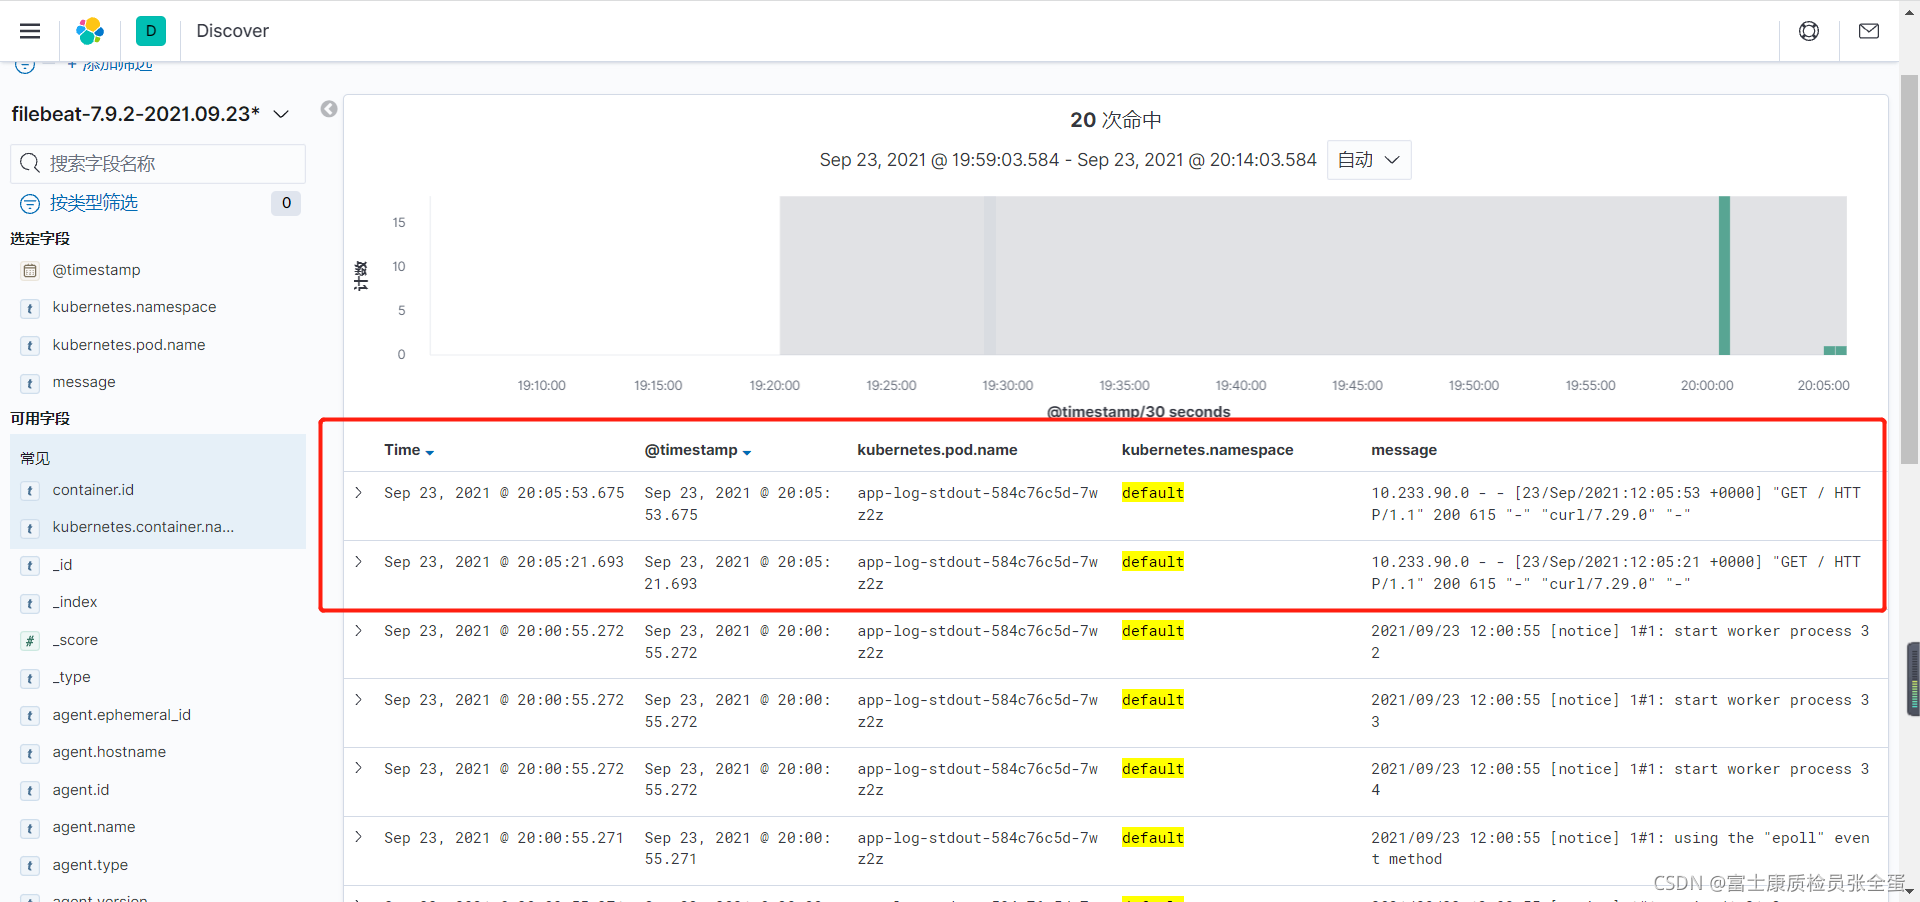
service/app-log-stdout ClusterIP 10.233.13.75 <none> 80/TCP 14m现在访问这个pod制造一条日志
[root@node1 ~]# curl 10.233.96.16
<!DOCTYPE html>
<html>
<head>
<title>Welcome to nginx!</title>
<style>
html { color-scheme: light dark; }
body { width: 35em; margin: 0 auto;
font-family: Tahoma, Verdana, Arial, sans-serif; }

[root@node1 ~]# curl 10.233.13.75
<!DOCTYPE html>
<html>
<head>
<title>Welcome to nginx!</title>
<style>
html { color-scheme: light dark; }
body { width: 35em; margin: 0 auto;
font-family: Tahoma, Verdana, Arial, sans-serif; }


[root@master elk]# kubectl logs app-log-stdout-584c76c5d-7wz2z
/docker-entrypoint.sh: /docker-entrypoint.d/ is not empty, will attempt to perform configuration
/docker-entrypoint.sh: Looking for shell scripts in /docker-entrypoint.d/
/docker-entrypoint.sh: Launching /docker-entrypoint.d/10-listen-on-ipv6-by-default.sh
10-listen-on-ipv6-by-default.sh: info: Getting the checksum of /etc/nginx/conf.d/default.conf
10-listen-on-ipv6-by-default.sh: info: Enabled listen on IPv6 in /etc/nginx/conf.d/default.conf
/docker-entrypoint.sh: Launching /docker-entrypoint.d/20-envsubst-on-templates.sh
/docker-entrypoint.sh: Launching /docker-entrypoint.d/30-tune-worker-processes.sh
/docker-entrypoint.sh: Configuration complete; ready for start up
2021/09/23 12:00:55 [notice] 1#1: using the "epoll" event method
2021/09/23 12:00:55 [notice] 1#1: nginx/1.21.3
2021/09/23 12:00:55 [notice] 1#1: built by gcc 8.3.0 (Debian 8.3.0-6)
2021/09/23 12:00:55 [notice] 1#1: OS: Linux 3.10.0-693.el7.x86_64
2021/09/23 12:00:55 [notice] 1#1: getrlimit(RLIMIT_NOFILE): 1048576:1048576
2021/09/23 12:00:55 [notice] 1#1: start worker processes
2021/09/23 12:00:55 [notice] 1#1: start worker process 31
2021/09/23 12:00:55 [notice] 1#1: start worker process 32
2021/09/23 12:00:55 [notice] 1#1: start worker process 33
2021/09/23 12:00:55 [notice] 1#1: start worker process 34
10.233.90.0 - - [23/Sep/2021:12:05:21 +0000] "GET / HTTP/1.1" 200 615 "-" "curl/7.29.0" "-"
10.233.90.0 - - [23/Sep/2021:12:05:53 +0000] "GET / HTTP/1.1" 200 615 "-" "curl/7.29.0" "-"
可以看到日志被filebeat采集到了
如果有需求可以部署logstash 根据不同的字段写到不同的索引里面。

最后,记得在filebeat里面配置污点容忍,这样才能调度到master节点上面去
tolerations:
- effect: NoSchedule
operator: Exists
serviceAccountName: filebeat
terminationGracePeriodSeconds: 30
containers:
- name: filebeat
image: elastic/filebeat:7.9.2
[root@master elk]# kubectl get pod -n ops -o wide
NAME READY STATUS RESTARTS AGE IP NODE NOMINATED NODE READINESS GATES
filebeat-65ztb 1/1 Running 0 21s 10.233.90.55 node1 <none> <none>
filebeat-8n25r 1/1 Running 0 21s 10.233.96.61 node2 <none> <none>
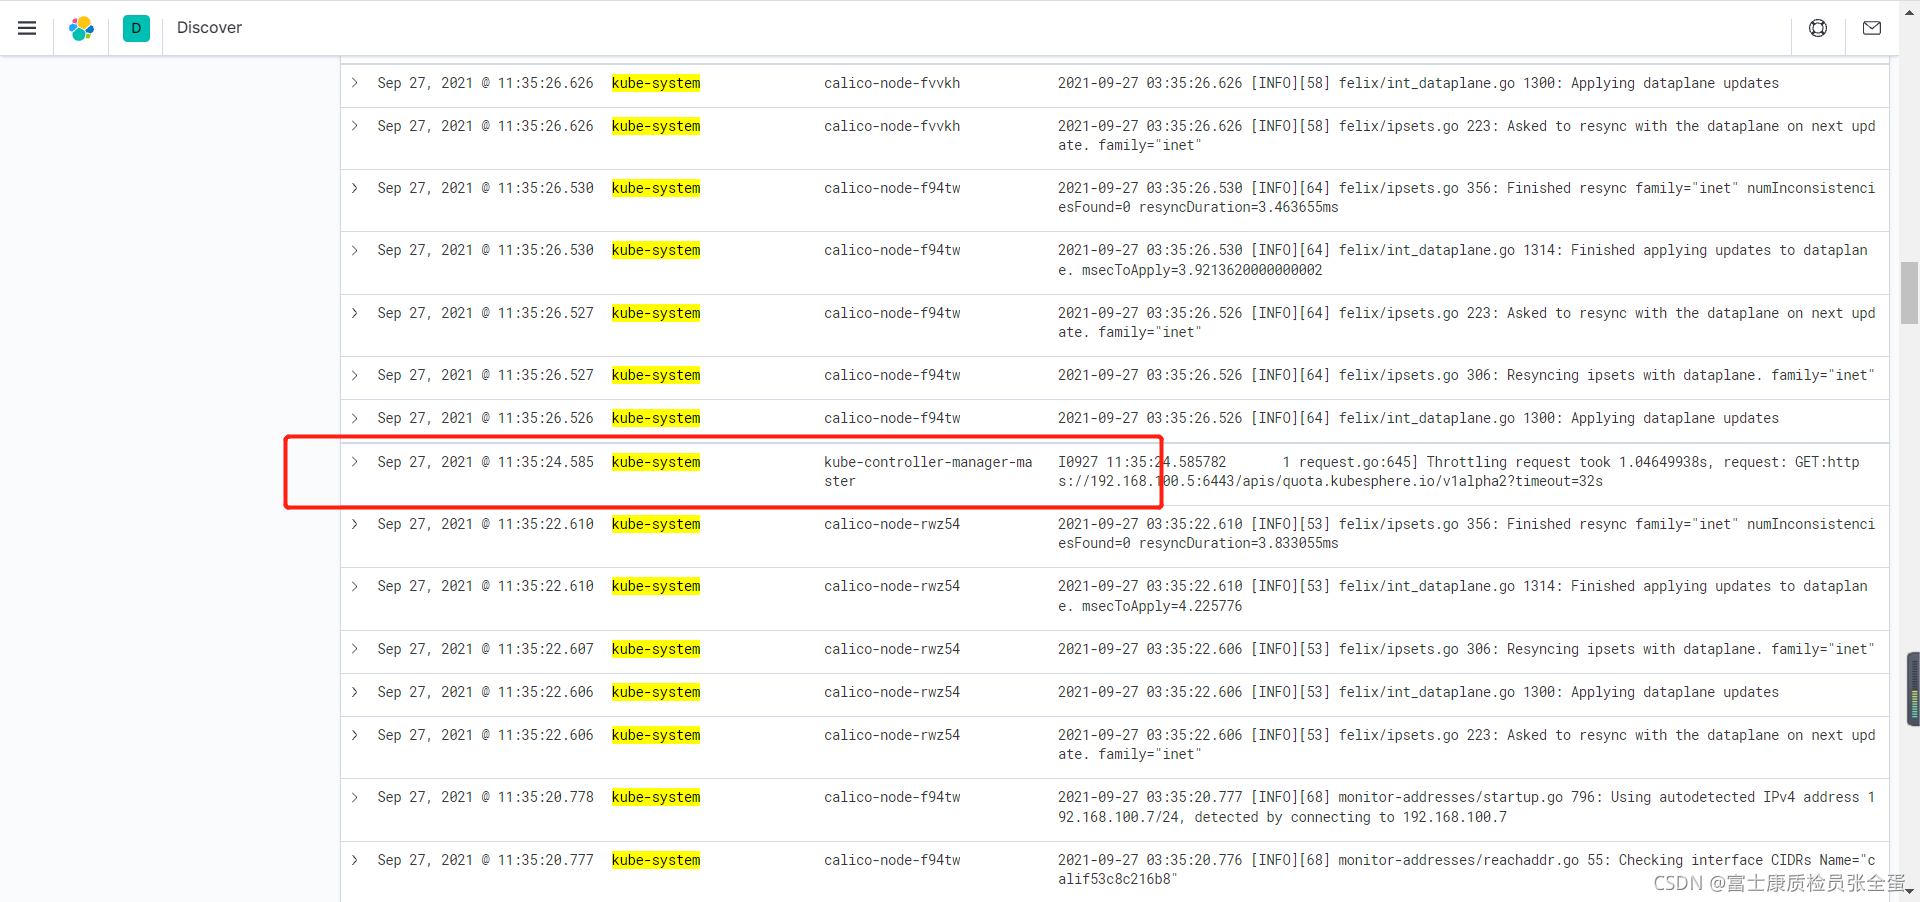
filebeat-gq8cg 1/1 Running 0 21s 10.233.70.25 master <none> <none>可以看到这些组件的日志都可以被采集到
kube-controller-manager-master kube-apiserver-master core-dns |