找了好几个文档总结了下括号里的参数代表的含义
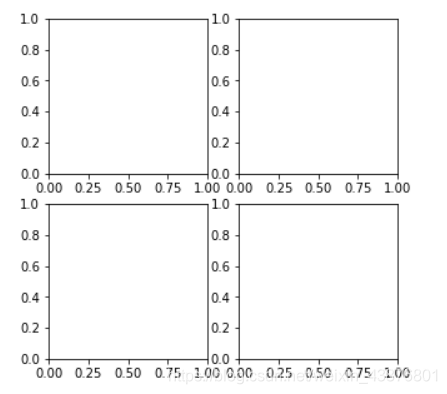
(xxx)这里前两个表示几*几的网格,最后一个表示第几子图
可能说的有点绕口,下面上程序作图一看说明就明白
import matplotlib.pyplot as plt
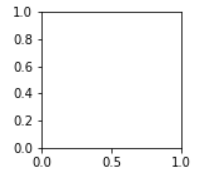
fig = plt.figure(figsize = (2,2))
ax = fig.add_subplot(111)
import matplotlib.pyplot as plt
fig = plt.figure(figsize = (5,5))
ax = fig.add_subplot(221)
ax = fig.add_subplot(222)
ax = fig.add_subplot(223)
ax = fig.add_subplot(224)
版权声明:本文为weixin_43876801原创文章,遵循CC 4.0 BY-SA版权协议,转载请附上原文出处链接和本声明。