echarts 立体柱状图(多个柱状图)

1.引入echarts.min.js(版本过低会出现一些让人头疼的报错)

https://cdn.bootcss.com/echarts/5.3.0/echarts.min.js
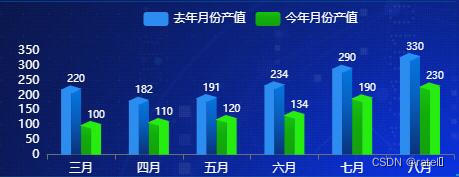
附上效果图及代码:


getEchart() {
            var chartDom = document.getElementById('echartsBox');
            var myChart = echarts.init(chartDom);
            var option;
            const sideData = [220, 182, 191, 234, 290, 330]
            const sideData1 = [100, 110, 120, 134, 190, 230]

            option = {
                tooltip: {
                    trigger: 'axis'
                },
                legend: {
                    data: [
                        {
                            name: "去年人数",
                            textStyle: {
                                color: 'white'
                            }
                        },
                        {
                            name: "今年人数",
                            textStyle: {
                                color: 'white'
                            }
                        }
                    ]
                },
                grid: {
                    top: '10%',
                    bottom: '62%',
                    right: '15%',
                    containLabel: true
                },
                toolbox: {
                    show: true,
                },
                calculable: true,
                xAxis: [
                    {
                        type: 'category',
                        splitLine: {
                            show: false
                        },
                        data: ['三月', '四月', '五月', '六月', '七月', '八月'],
                        axisLabel: {
                            show: true,
                            textStyle: {
                                color: "#fff" //X轴文字颜色
                            },
                        },
                    }
                ],
                yAxis: [
                    {
                        type: 'value',
                        splitLine: {
                            show: false
                        },
                        axisLabel: {
                            show: true,
                            textStyle: {
                                color: "#fff" //X轴文字颜色
                            },
                        },
                    }
                ],
                series: [
                    {
                        name: '去年人数',
                        tooltip: {
                            show: false
                        },
                        type: 'bar',
                        barWidth: 10,
                        itemStyle: {
                            normal: {
                                color: new echarts.graphic.LinearGradient(0, 1, 0, 0, [{
                                    offset: 0,
                                    color: "#2d8cf0" // 0% 处的颜色
                                }, {
                                    offset: 0.6,
                                    color: "#2d8cf0" // 60% 处的颜色
                                }, {
                                    offset: 1,
                                    color: "#2d8cf0" // 100% 处的颜色
                                }], false)
                            }
                        },
                        data: sideData,
                        barGap: 0,
                    }, {
                        name: '去年人数',
                        type: 'bar',
                        barWidth: 10,
                        itemStyle: {
                            normal: {
                                color: new echarts.graphic.LinearGradient(0, 1, 0, 0, [{
                                    offset: 0,
                                    color: "#09337C" // 0% 处的颜色
                                }, {
                                    offset: 0.6,
                                    color: "#0761C0" // 60% 处的颜色
                                }, {
                                    offset: 1,
                                    color: "#0575DE" // 100% 处的颜色
                                }], false)
                            }
                        },
                        barGap: 0,
                        data: sideData,
                        label: {
                            show: true,
                            position: 'top',
                            textStyle: {
                                color: 'white',
                                fontSize: 10
                            }
                        }
                    }, {
                        name: '去年人数',
                        tooltip: {
                            show: false
                        },
                        type: 'pictorialBar',
                        itemStyle: {
                            borderWidth: 1,
                            borderColor: '#0571D5',
                            color: '#288ef3' // 控制顶部方形的颜色
                        },
                        symbol: 'path://M 0,0 l 90,0 l -60,60 l -90,0 z',
                        symbolSize: ['20', '7'], // 第一个值控制顶部方形大小
                        symbolOffset: ['-10', '-4'], // 控制顶部放行 左右和上下
                        symbolRotate: -16,
                        symbolPosition: 'end',
                        data: sideData,
                        z: 3,
                    },
                    {
                        name: '今年人数',
                        tooltip: {
                            show: false
                        },
                        type: 'bar',
                        barWidth: 10,
                        itemStyle: {
                            normal: {
                                color: new echarts.graphic.LinearGradient(0, 1, 0, 0, [{
                                    offset: 0,
                                    color: "#15a00f" // 0% 处的颜色
                                }, {
                                    offset: 0.6,
                                    color: "#11ad0a" // 60% 处的颜色
                                }, {
                                    offset: 1,
                                    color: "#19c213" // 100% 处的颜色
                                }], false)
                            }
                        },
                        data: sideData1,
                        barGap: 0,

                    }, {
                        name: '今年人数',
                        type: 'bar',
                        barWidth: 10,
                        itemStyle: {
                            normal: {
                                color: new echarts.graphic.LinearGradient(0, 1, 0, 0, [{
                                    offset: 0,
                                    color: "#26ec10" // 0% 处的颜色
                                }, {
                                    offset: 0.6,
                                    color: "#26ec10" // 60% 处的颜色
                                }, {
                                    offset: 1,
                                    color: "#26ec10" // 100% 处的颜色
                                }], false)
                            }
                        },
                        barGap: 0,
                        data: sideData1,
                        label: {
                            show: true,
                            position: 'top',
                            textStyle: {
                                color: 'white',
                                fontSize: 10
                            }
                        }
                    }, {
                        name: '今年人数',
                        tooltip: {
                            show: false
                        },
                        type: 'pictorialBar',
                        itemStyle: {
                            borderWidth: 1,
                            borderColor: '#fff',
                            color: '#26ec10' // 顶部方块的颜色
                        },
                        symbol: 'path://M 0,0 l 90,0 l -60,60 l -90,0 z',
                        symbolSize: ['20', '7'], // 第一个值控制顶部方形大小
                        symbolOffset: ['10', '-4'], // 控制顶部放行 左右和上下
                        symbolRotate: -16,
                        symbolPosition: 'end',
                        data: sideData1,
                        z: 3,

                    }]
            };

            myChart.setOption(option, true);
        },


版权声明:本文为cjy_fly原创文章,遵循CC 4.0 BY-SA版权协议,转载请附上原文出处链接和本声明。