python macd算法
Machine Learning trading works just fine for large hedge funds that make thousands of trades per day. However, private traders just don’t have the facilities to run machine learning models with millions of parameters on real time. This is why private algorithmic traders, use technical indicators to make automatic trades.
机器学习交易对于每天进行数千笔交易的大型对冲基金来说效果很好。 但是,私人交易者只是没有实时运行具有数百万个参数的机器学习模型的功能。 这就是为什么私人算法交易者使用技术指标进行自动交易的原因。
什么是MACD? (What is MACD?)
The technical indicator I will use today is MACD, Moving Average Convergence Divergence, is a momentum indicator, that shows the relationship between two moving averages. The MACD is calculated by subtracting the 26-period EMA from the 12-period EMA.
我今天将使用的技术指标是MACD,移动平均线收敛发散,是一种动量指标,它显示了两个移动平均线之间的关系。 通过从12期EMA中减去26期EMA来计算MACD。
This MACD line is plotted on a signal line (9-period EMA). The intersections of these two lines are the signals of the MACD indicator. If the MACD indicator intersected into the signal line from below, it would be an uptrend. If the MACD indicator intersected from above the signal line, it would be a down-trend.
此MACD线绘制在信号线(9周期EMA)上。 这两条线的交点是MACD指示器的信号。 如果MACD指标从下方横穿信号线,那将是一个上升趋势。 如果MACD指标从信号线上方交叉,那将是一个下跌趋势。
概念: (Concept:)
To be efficient when programming, it is necessary to create a general idea of how the program is supposed to work, in-order to have a clear goal in mind. This program should be able to plot the MACD signal and the MACD line, and make trades based on signals from the MACD indicator. A good program should also be able to evaluate the profitability of a trading strategy, so as to optimize it.
为了提高编程效率,有必要对程序的工作原理有一个总体了解,以便牢记明确的目标。 该程序应能够绘制MACD信号和MACD线,并基于来自MACD指标的信号进行交易。 一个好的程序还应该能够评估交易策略的获利能力,以便对其进行优化。
代码: (The Code:)
import yfinance
import talib
from matplotlib import pyplot as plt
These are the libraries that I will use for the program. yfinance is used to download financial data of shares, talib is used to calculate the values of the MACD indicator. Matplotlib is used to plot the data, to better understand how the technical indicator.
这些是我将用于程序的库。 yfinance用于下载股票的财务数据,talib用于计算MACD指标的值。 Matplotlib用于绘制数据,以更好地了解技术指标。
data = yfinance.download('NFLX','2016-1-1','2020-1-1')
data["macd"], data["macd_signal"], data["macd_hist"] = talib.MACD(data['Close'])
fig = plt.figure()
This script downloads the data, and then it calculates the macd values such as the signal and the histogram that defines the trend.
此脚本下载数据,然后计算macd值,例如信号和定义趋势的直方图。
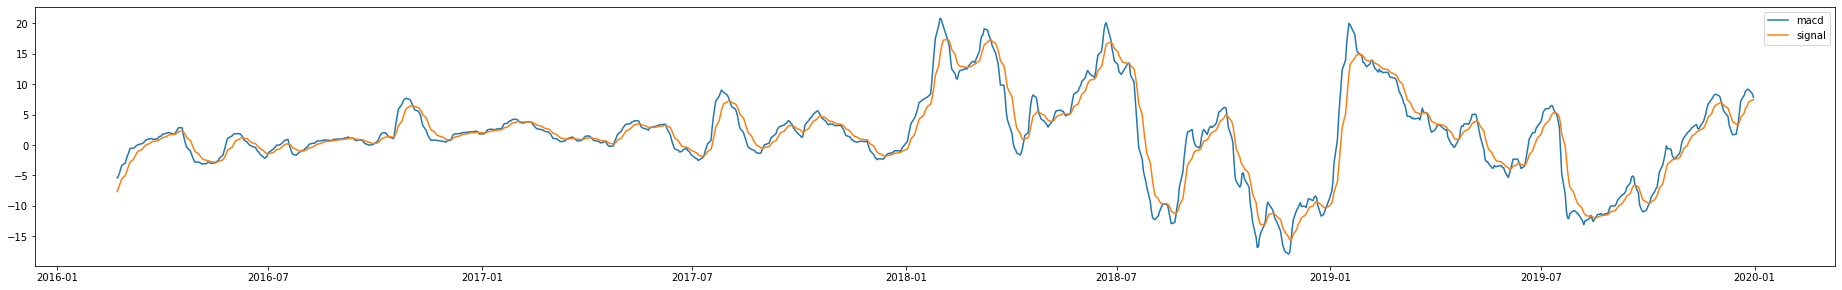
This is the graph of the two lines of the MACD indicator and the signal line. This is just to troubleshoot the program to make sure the indicator is working. As we can see, the indicator is clearly working, as the two lines intersect frequently.
这是MACD指示器和信号线的两条线的曲线图。 这仅仅是为了对程序进行故障排除,以确保指示灯正常工作。 如我们所见,由于两条线频繁相交,因此指标显然很有效。
def intersection(lst_1,lst_2):
    intersections = []
    insights = []
    if len(lst_1) > len(lst_2):
        settle = len(lst_2)
    else:
        settle = len(lst_1)
    for i in range(settle-1):
        if (lst_1[i+1] < lst_2[i+1]) != (lst_1[i] < lst_2[i]):
            if ((lst_1[i+1] < lst_2[i+1]),(lst_1[i] < lst_2[i])) == (True,False):
                insights.append('buy')
            else:
                insights.append('sell')
            intersections.append(i)
    return intersections,insightsintersections,insights = intersection(data["macd_signal"],data["macd"])
The intersection function uses a reasonably unconventional way of finding intersections:
相交函数使用一种合理的非常规方式来查找相交:
- If the value from list 1 is bigger than the value of the same index in list 2, store True. Else, store False.如果列表1中的值大于列表2中相同索引的值,则存储True。 否则,存储False。
- Apply this function to an index of 1 greater. If the stored value is different, an intersection must have happened.将此函数应用于大于1的索引。 如果存储的值不同,则必须发生交集。
This is the only way to calculate intersections, as the intersection could have happened in between the real points, making it impossible to find similar points within the two lists.
这是计算相交的唯一方法,因为相交可能发生在真实点之间,因此无法在两个列表中找到相似的点。
We use this function to find the points of intersection and make a note of if the program would sell or buy the stock.
我们使用此功能查找交点,并记下该程序是否出售或购买股票。
To make a stock trading program good, we must evaluate the profitability of the program.
为了使股票交易程序更好,我们必须评估该程序的盈利能力。
profit = 0
pat = 1
for i in range(len(intersections)-pat):
    index = intersections[i]
    true_trade= None
    if data['Close'][index] < data['Close'][index+pat]:
        true_trade = 'buy'
    elif data['Close'][index] > data['Close'][index+pat]:
        true_trade = 'sell'
    if true_trade != None:
        if insights[i] == true_trade:
            profit += abs(data['Close'][index]-data['Close'][index+1])
        if insights[i] != true_trade:
            profit += -abs(data['Close'][index]-data['Close'][index+1])
This program calculates the profitability by calculating the true_trade, which stores the value of if the value went up or dropped. If the trade made matched the true_trade variable, the trade was profitable. If the trade did not match, the trade lost.
该程序通过计算true_trade来计算获利能力,其中true_trade存储值的增加或减少。 如果交易与true_trade变量匹配,则该交易是有利可图的。 如果交易不匹配,则交易失败。
When running the program, the profit was -288.26. What?
运行该程序时,利润为-288.26。 什么?
怎么了? (What is happening?)
I found this error and kept trying to mess with the patience value, that is how long after the intersection was made, the trade was made. All values were negative. When facing a problem like this, in which the polarity of the values are all wrong, one can easily change the polarity.
我发现了这个错误,并一直试图与耐心值搞混,那就是在完成十字路口交易后多长时间。 所有值均为负。 当面对这样一个问题,即值的极性全部错误时,可以轻松更改极性。
In this case, this is because the intersection order is incorrect! When we made the intersections, we did the opposite insights from the strategy we described! For example, if the MACD line intersected from above, the program would mark this as a increase in price! This would make all the trades that were supposed to be profitable, to become a loss!
在这种情况下,这是因为相交顺序不正确! 当我们进行交叉时,我们从所描述的策略中得出了相反的见解! 例如,如果MACD线从上方交叉,则程序会将其标记为价格上涨! 这会使所有本应有利可图的交易变成亏损!
By changing the intersection code to this:
通过将交集代码更改为此:
def intersection(lst_1,lst_2):
    intersections = []
    insights = []
    if len(lst_1) > len(lst_2):
        settle = len(lst_2)
    else:
        settle = len(lst_1)
    for i in range(settle-1):
        if (lst_1[i+1] < lst_2[i+1]) != (lst_1[i] < lst_2[i]):
            if ((lst_1[i+1] < lst_2[i+1]),(lst_1[i] < lst_2[i])) == (True,False):
                insights.append('buy')
            else:
                insights.append('sell')
            intersections.append(i)
    return intersections,insightsintersections,insights = intersection(data["macd_signal"],data["macd"])
We gain a profit of 298 dollars!
我们获得298美元的利润!
结论: (Conclusion:)
I wrote another article about RSI, and that program only made 58 dollars with the same data. This program made 298 dollars, buying one share for each trade. Here are a few ways you can improve my program:
我写了另一篇有关RSI的文章,使用相同的数据该程序仅赚了58美元。 该程序赚了298美元,每笔交易购买一股。 您可以通过以下几种方法来改进我的程序:
- Tweak the patience variable调整耐心变量
This variable is how long after the intersection,the trade will be made. Toy with this value, find a pattern, and optimize it to get better results.
这个变量是相交后要进行多长时间。 以此值进行计算,找到一个模式,然后对其进行优化以获得更好的结果。
2. Find the best share
2.找到最好的份额
For which stock does this algorithm work best? Test this program on different companies to evaluate.
该算法最适合哪种股票? 在不同的公司上测试此程序以进行评估。
Thank you for reading my article!
感谢您阅读我的文章!
翻译自: https://towardsdatascience.com/algorithmic-trading-with-macd-and-python-fef3d013e9f3
python macd算法