先来个效果图:
图片是静态的,没有体现出来动态的效果,实际效果是测距和面积会随着鼠标的位置实时显示当前线段的长度或者面积大小。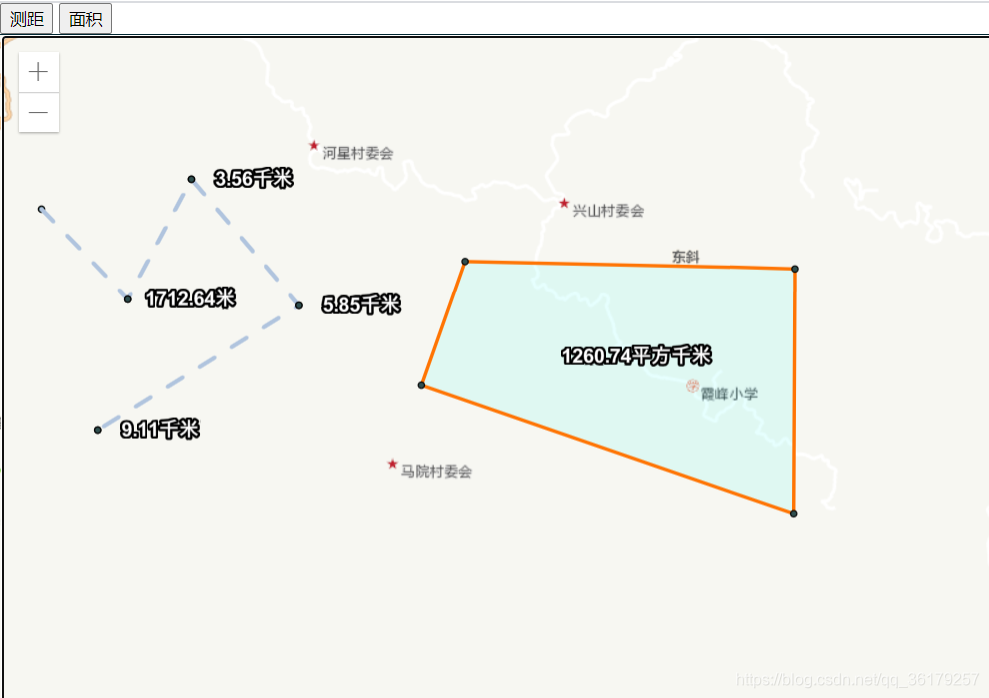
本例采用arcgis api 4.x,原理是调用draw绘制工具,监听draw过程中的不同事件,并通过事件中获得的经纬度信息去绘制polyline和polygon。draw事件参考官方文档:4.x draw文档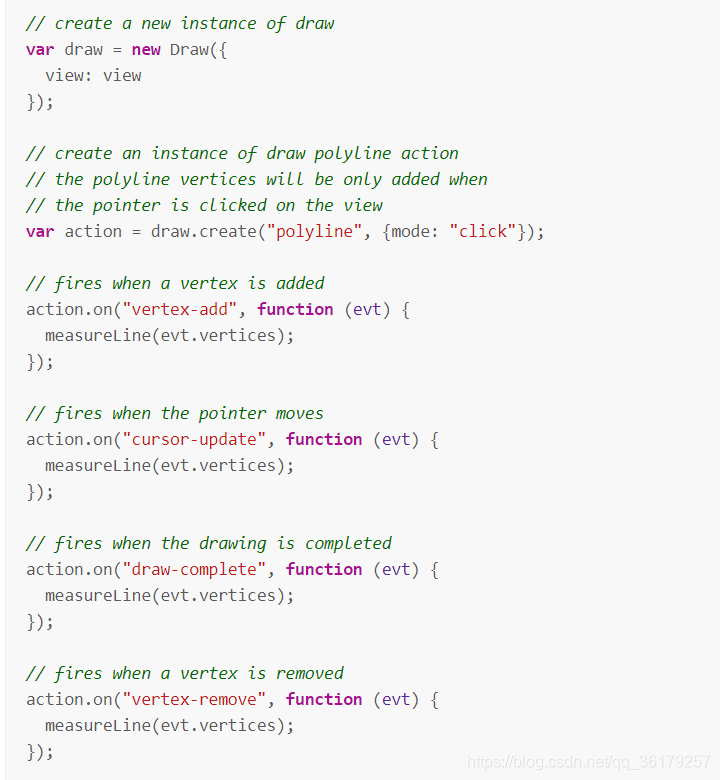
通过"esri/geometry/geometryEngine" 中的geodesicLength()和geodesicArea()方法去计算长度和面积。官方文档:geodesicLength()和geodesicArea()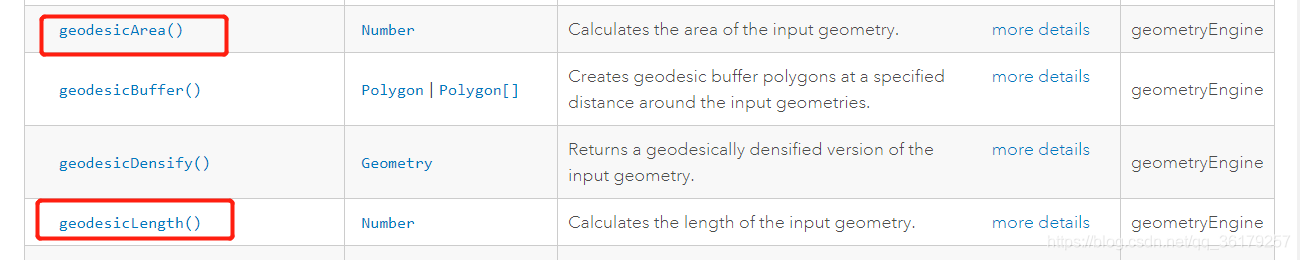
全部代码:复制可直接运行。
<!DOCTYPE HTML PUBLIC "-//W3C//DTD HTML 4.01//EN" "http://www.w3.org/TR/html4/strict.dtd">
<html>

<head>
  <meta http-equiv="Content-Type" content="text/html; charset=utf-8">
  <meta http-equiv="X-UA-Compatible" content="IE=7,IE=9" />
  <meta name="viewport" content="width=device-width, initial-scale=1.0">
  <title>arcgis api 4.x 实现动态测距和计算面积</title>
  <link rel="stylesheet" href="https://js.arcgis.com/4.15/esri/themes/light/main.css">
  <style>
    body,
    html {
      margin: 0;
      padding: 0;
      width: 100%;
      height: 100%;
      font-family: Arial;
    }
    #map {
      width: 100%;
      height: 100%;
      margin: 0;
      padding: 0;
      border: 0px dashed black;
      background-color: rgb(0, 38, 48);
    }
  </style>
</head>
<body>
  <button type="button" onclick="drawLine()">测距</button>
  <button type="button" onclick="drawPolygon()">面积</button>
  <div id="map">
  </div>
</body>
<script src="https://js.arcgis.com/4.15/"></script>
<script type="text/javascript">
  var map, drawLine, drawPolygon;
  require([
    "esri/Map",
    'esri/Color',
    'esri/symbols/SimpleLineSymbol',
    "esri/views/MapView",
    "esri/layers/TileLayer",
    'esri/views/draw/Draw',
    'esri/geometry/geometryEngine',
    'esri/geometry/Point',
    'esri/geometry/Polyline',
    'esri/geometry/Polygon',
    'esri/layers/GraphicsLayer',
    'esri/Graphic',
    "dojo/domReady!"
  ], function(
    Map,
    Color,
    SimpleLineSymbol,
    MapView,
    TileLayer,
    Draw,
    GeometryEngine,
    Point,
    Polyline,
    Polygon,
    GraphicsLayer,
    Graphic
  ) {
    var tileLayer = new TileLayer({ //arcgis在线地图
      url: "http://cache1.arcgisonline.cn/arcgis/rest/services/ChinaOnlineCommunity/MapServer"
    })

    var lineLayer = new GraphicsLayer() //绘制线图层
    var polygonLayer = new GraphicsLayer() //绘制面图层
    map = new Map({
      layers:[tileLayer, lineLayer, polygonLayer],
      });
    map.on('load', function() {
      map.hideZoomSlider()
      map.hidePanArrows()
      map.disableDoubleClickZoom() //禁用双击缩放
    })

    var view = new MapView({//创建视图
      container: "map",
      map: map,
      zoom: 8,
      spatialReference: {wkid: 3857},
      center: [110.72, 18.92] // longitude, latitude
    });

    //画线按钮事件
    drawLine = function() {
      let draw = new Draw({ //在view里创建draw
        view: view
      })
      let action = draw.create("polyline") //创建画线实例
      view.focus()
      action.on(
        [
          "vertex-add", // when a vertex is added  鼠标单击
          "vertex-remove", // when a vertex is removed 移除
          "cursor-update", // when the pointer moves 鼠标移动
          "draw-complete" // when the drawing is completed 鼠标双击
        ],
        function(evt){
          createLine(evt.vertices)
        }
      )
    }
     //画面按钮事件
    drawPolygon = function() {
      let draw = new Draw({ //在view里创建draw
        view: view
      })
      let action = draw.create("polygon") //创建画线实例
      view.focus()
      action.on(
        [
          "vertex-add", // when a vertex is added  鼠标单击
          "vertex-remove", // when a vertex is removed 移除
          "cursor-update", // when the pointer moves 鼠标移动
          "draw-complete" // when the drawing is completed 鼠标双击
        ],
        function(evt){
          createPolygon(evt.vertices)
        }
      )
    }

    //画线和测距
    createLine = function(vertices) {
      lineLayer.removeAll() //清空上次绘制的线
      let symbol = {  //点样式
        type: "simple-marker",
        color: [47,79,79],
        width: 0.5,
        size: 4,
        outline: {
          color: [ 0, 0, 0 ],
          width: 1
        }
      }
      //将起点添加到地图
      let startGraphics = new Graphic({
        geometry: new Point({
          type: "point",
          x: vertices[0][0], //当底图是投影坐标系时用x,地理坐标系用longitude
          y: vertices[0][1], //当底图是投影坐标系时用y,地理坐标系用latitude
          spatialReference: view.spatialReference //和底图相同的坐标系
        }),
        symbol: symbol
      })

      lineLayer.add(startGraphics)
      //将线添加到地图
      let lineGraphics = new Graphic({
        geometry: new Polyline({
          paths: vertices,
          spatialReference: view.spatialReference
        }),
        symbol: { //线样式
          type: "simple-line", // autocasts as new SimpleFillSymbol
          style: "dash",
          color: [176,196,222],
          width: 2
        }
      });
      lineLayer.add(lineGraphics)

      //测距
      let linePath = []  //线段坐标集合
      pointStart = [] //起点
      pointStart.push(vertices[0][0])
      pointStart.push(vertices[0][1])
      linePath.push(pointStart)

      for (let i = 1; i < vertices.length ; i++) { //获得鼠标移动的坐标信息
        let point = {
          type:"point",
          x:vertices[i][0],
          y:vertices[i][1],
          spatialReference: view.spatialReference
        };
        //鼠标位置
        let mouseGraphics = new Graphic({
          geometry:point,
          symbol: symbol
        })
        let xy = [] //鼠标当前经纬度
        xy.push(vertices[i][0])
        xy.push(vertices[i][1])
        linePath.push(xy)
        let line = new Polyline({ //起点到当前鼠标的线段
          paths: linePath,
          spatialReference: view.spatialReference
        })
        let length = GeometryEngine.geodesicLength(line, 'meters').toFixed(2) //测距
        let lengthText = lengthFormat(length) //单位转换
        let textSymbol = { //距离标注
          type: "text",
          color: "white",
          haloColor: "black",
          haloSize: "2px",
          text: lengthText,
          xoffset: '50px',
          yoffset: '-5px',
          font: {
            size: 12,
            family: "sans-serif",
            weight: "bold"
          }
        }
        let textGraphics = new Graphic({ //标注位置为鼠标位置
          geometry:point,
          symbol: textSymbol
        });
        //将标注和鼠标位置添加到地图
        lineLayer.addMany([textGraphics, mouseGraphics ])
      }
    }

    //画面和测量面积
    createPolygon = function(vertices) {
      polygonLayer.removeAll();
      let symbol = {  //点样式
        type: "simple-marker",
        color: [47,79,79],
        width: 0.5,
        size: 4,
        outline: {
          color: [ 0, 0, 0 ],
          width: 1
        }
      }
      let fillSymbol = { //面样式
        type: "simple-fill", // autocasts as new SimpleFillSymbol()
        color: [3, 255, 240, 0.1],
        outline: { // autocasts as new SimpleLineSymbol()
          color: [255,116,3],
          width: 2
        }
      }

      let polygon = new Polygon({
        rings: vertices,
        spatialReference: view.spatialReference
      })

      let polygonGraphics = new Graphic({
        geometry: polygon,
        symbol: fillSymbol
      })
      polygonLayer.add(polygonGraphics);
      let area = GeometryEngine.geodesicArea(polygon,'square-meters')
      let areaText = areaFormat(area)
      let center = polygon.centroid
      let pointCenter = {
        type:"point",
        longitude:center.longitude,
        latitude:center.latitude
      };
      let textSymbol = { //面积标注
        type: "text",
        color: "white",
        haloColor: "black",
        haloSize: "2px",
        text: areaText,
        //xoffset: '50px',
        //yoffset: '-5px',
        font: {
          size: 12,
          family: "sans-serif",
          weight: "bold"
        }
      }
      let textGraphics = new Graphic({ //标注为面中心位置
        geometry:pointCenter,
        symbol: textSymbol
      });
      polygonLayer.add(textGraphics);

      for (let i = 0; i <vertices.length ; i++) {
        let point = {
            type:"point",
            x:vertices[i][0],
            y:vertices[i][1],
            spatialReference: view.spatialReference
        };

        let pointGraphics=new Graphic({
          geometry:point,
          symbol: symbol
        });
        polygonLayer.add(pointGraphics)
      }
    }

    //长度单位转换
    function lengthFormat(length) {
      if (length < 2000) {
        return lengthText = length + "米"
      }
      else {
        length = (length/1000).toFixed(2)
        return lengthText = length + "千米"
      }
    }

    //面积单位转换
    function areaFormat(area) {
      if (area < 2000) {
        area = area.toFixed(2)
        return areaText = area + "平方米"
      }
      else {
        area = (area/10000).toFixed(2)
        return areaText = area + "平方千米"
      }
    }
  });
</script>
</html>
版权声明:本文为qq_36179257原创文章,遵循CC 4.0 BY-SA版权协议,转载请附上原文出处链接和本声明。