golang的gdb之dlv
众所周知gdb是调试c非常好用的一款软件,当然也可以调试golang的二进制文件。不过今天的主角并不是gdb,而是dlv,和gdb类似,也是具有断点调试,输出变量的一系列的功能。
安装
安装方式一:
$ git clone https://github.com/go-delve/delve
$ cd delve
$ go install github.com/go-delve/delve/cmd/dlv
安装方式二
(适用于Go 1.16及以后版本)
$ go install github.com/go-delve/delve/cmd/dlv@latest
执行完命令后,dlv命令被安装在 GOPATH/bin目录下。如果没有设置GOPATH,则被默认安装在$HOME/go/bin目录下。
输入dlv命令检查是否安装成功:
$ dlv version
Delve Debugger
Version: 1.8.3
Build: $Id: f92bb46b82b3b92d79ce59c4b55eeefbdd8d040c $
使用
基于pid
这种是通常已经跑的进程。命令 dlv attach pid.
这里写了一个死循环每一秒输出一个hello,让进程不会退出
package main

import (
	"fmt"
	"time"
)

func main() {
	var a interface{}
	a = 1

	if a != nil {
		for {
			fmt.Println("hello")
			time.Sleep(1 * time.Second)
		}
	}

}
然后go run main.go运行起来。通过 ps -ef | grep main 找到这个进程id。
可以看到这个pid是31164。
于是通过 dlv attach 31164进行交互,如图: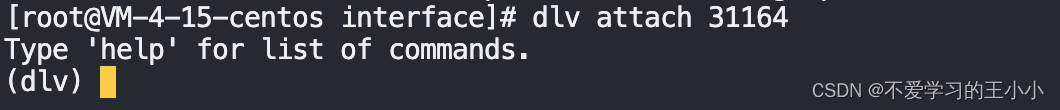
这样就进入了调试模式,关于哪些命令和dlv debug模式一起说。
基于main文件
就是程序还未启动,直接用dlv去启动并调试程序,命令: dlv debug main.go.这里就是把go run 换成 dlv debug后,就可以进入到交互模式,如图: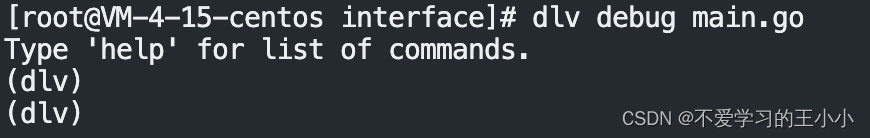
常用命令
运行程序
 call ------------------------ Resumes process, injecting a function call (EXPERIMENTAL!!!)
    continue (alias: c) --------- Run until breakpoint or program termination.
    next (alias: n) ------------- Step over to next source line.
    rebuild --------------------- Rebuild the target executable and restarts it. It does not work if the executable was not built by delve.
    restart (alias: r) ---------- Restart process.
    step (alias: s) ------------- Single step through program.
    step-instruction (alias: si)  Single step a single cpu instruction.
    stepout (alias: so) --------- Step out of the current function.
这里用的比较多的是c,n,s.这三个命令。下面来举个例子。
continue
如下在fmt.Println这里打了一个断点: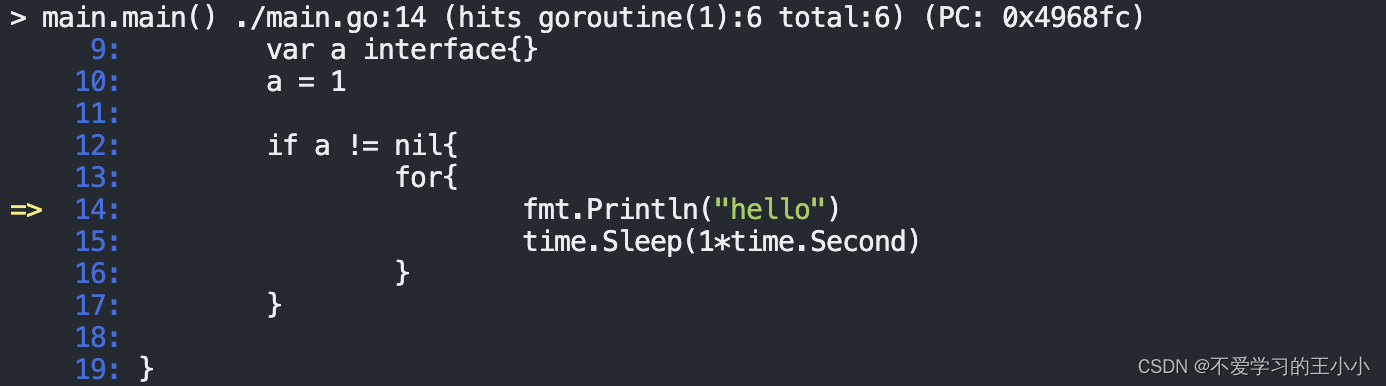
然后执行continue,也就是c,可见执行完了输出hello,又到了下一个断点。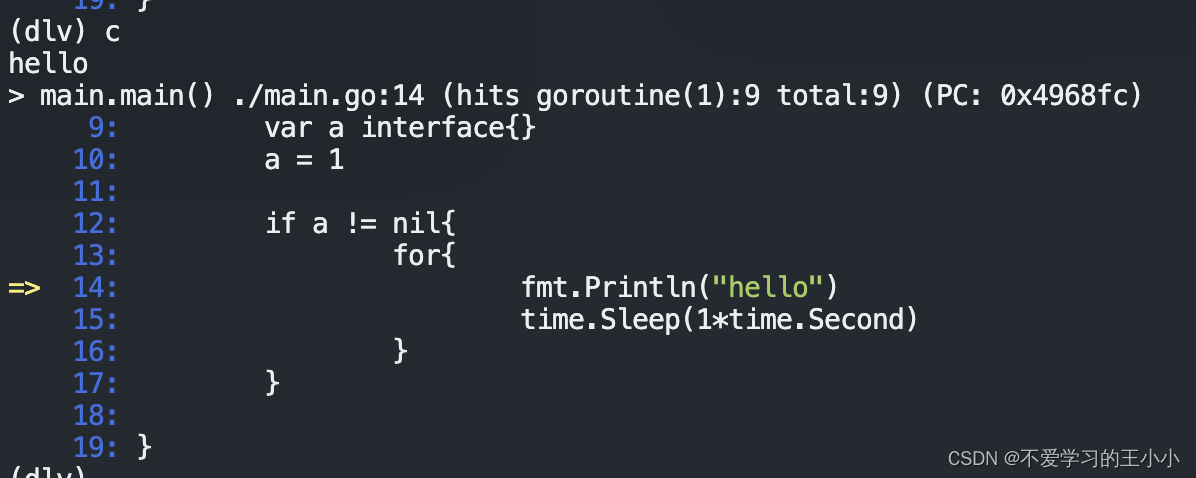
next
next解释是 Step over to next source line.也就是执行到下一个代码行。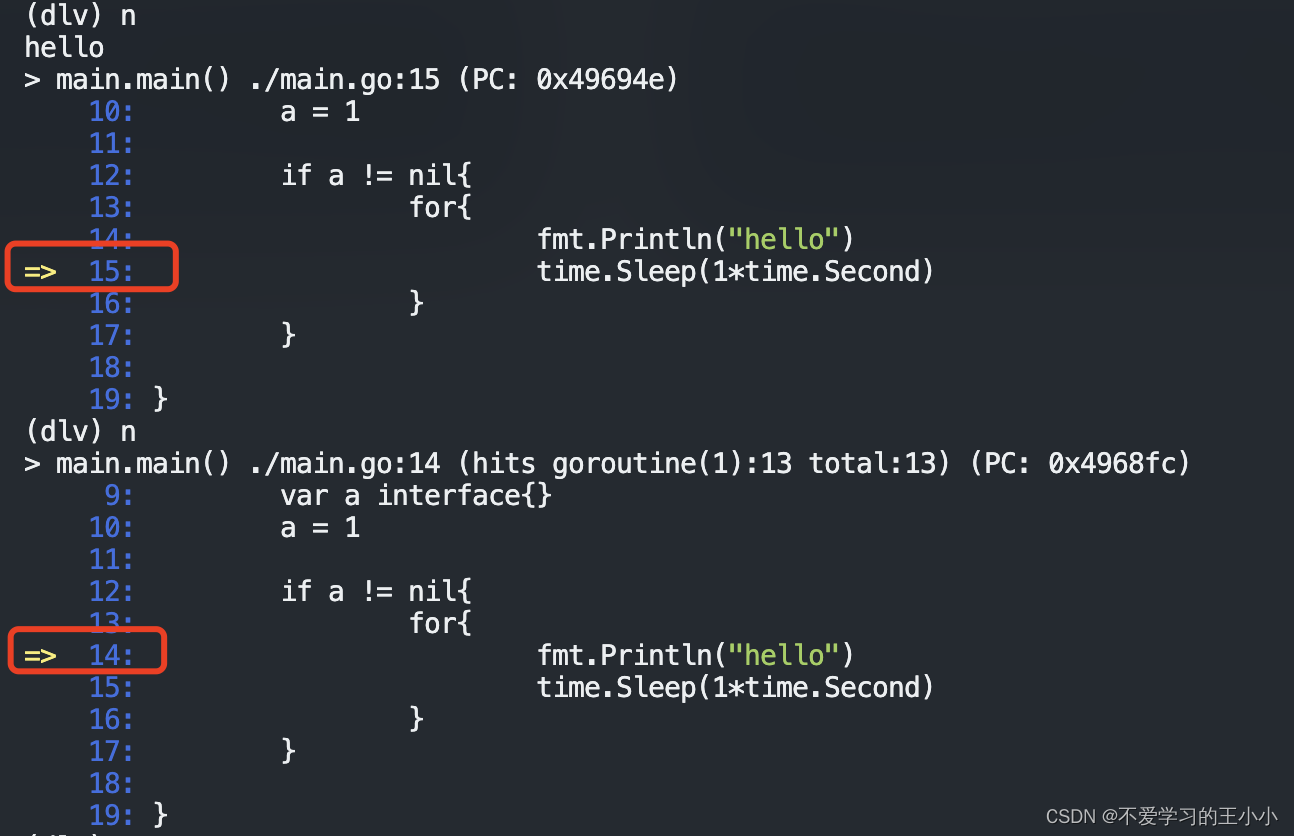
可见分别是14行和15行,也就是执行到下一个代码行
step
官方解释是Single step through program。就是进入到下一个代码行,但是和next不同的是,会进入下一个代码执行的地方.如图执行到了fmt.Println(“hello”)这里,源码是在/usr/local/go/src/fmt/print.go 中273行。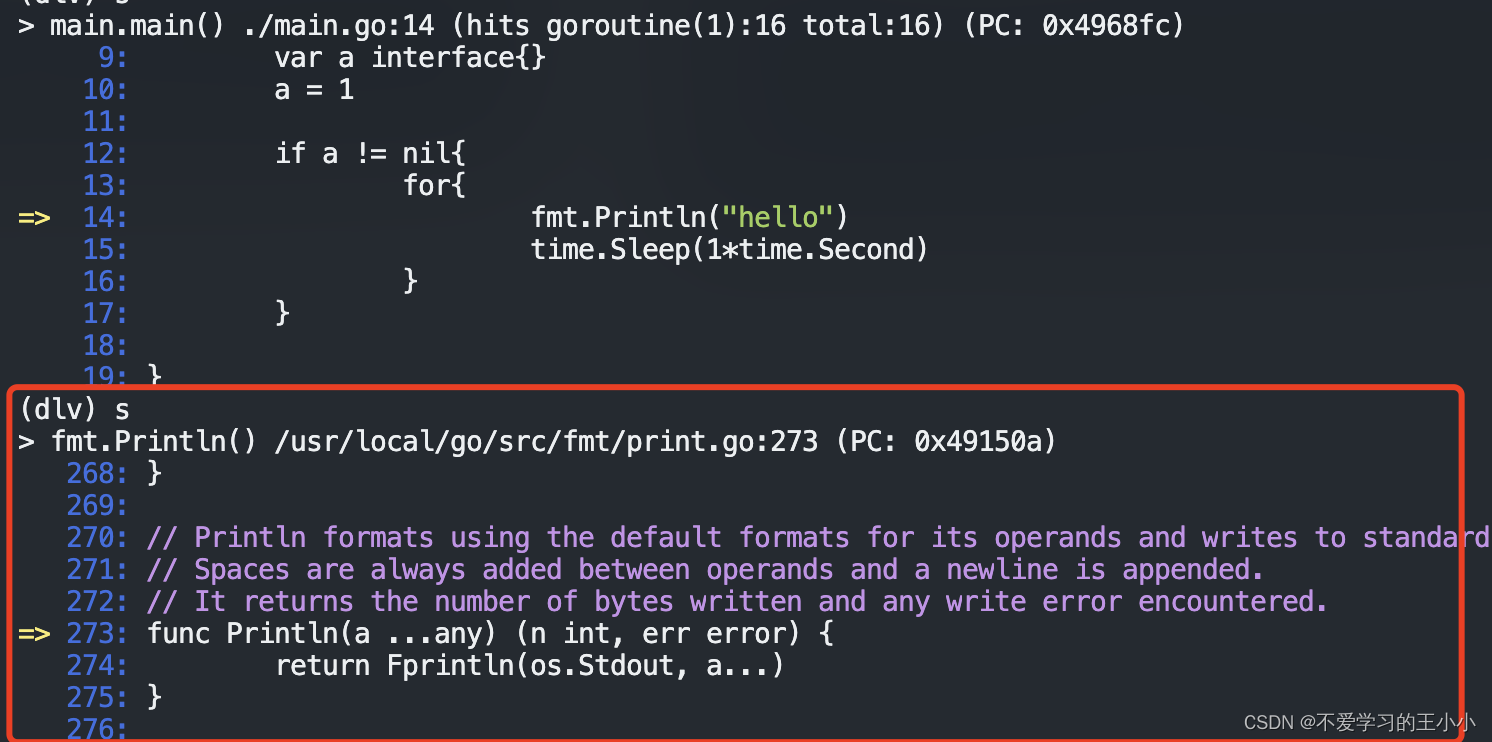
打断点
Manipulating breakpoints:
    break (alias: b) ------- Sets a breakpoint.
    breakpoints (alias: bp)  Print out info for active breakpoints.
    clear ------------------ Deletes breakpoint.
    clearall --------------- Deletes multiple breakpoints.
    condition (alias: cond)  Set breakpoint condition.
    on --------------------- Executes a command when a breakpoint is hit.
    toggle ----------------- Toggles on or off a breakpoint.
    trace (alias: t) ------- Set tracepoint.
    watch ------------------ Set watchpoint.
break
缩写是b,也就是打断点。需要记住的是这个打断点不仅可以在自己程序里面打断点,
在自己程序里面打。指定包名称和方法名称和行号,如图。这个main是当前main包。然后后面一个main是方法名称,4是行号,在整个文件中在14行。
同时这个也可以打源码中的断点,runtime就是go官方包的runtime包,如图:
/usr/local/go/src/runtime/proc.go中的main就是go的g0线程执行的main,并在这个里面初始化了gc等一系列操作。
breakpoints
breakpoints显示有哪些断点,如图
clear
清楚断点,这里是的值是breakpoints的名称。
这里的1就是breakpoints中的名称如图
clearall
清楚所有的断点
查看程序内存和变量
Viewing program variables and memory:
    args ----------------- Print function arguments.
    display -------------- Print value of an expression every time the program stops.
    examinemem (alias: x)  Examine raw memory at the given address.
    locals --------------- Print local variables.
    print (alias: p) ----- Evaluate an expression.
    regs ----------------- Print contents of CPU registers.
    set ------------------ Changes the value of a variable.
    vars ----------------- Print package variables.
    whatis --------------- Prints type of an expression.
args
输出方法的参数。这里走到Println这个方法这里,a是输入的变量,n和err是返回的,因为被提前初始化了,所以也输出了出来。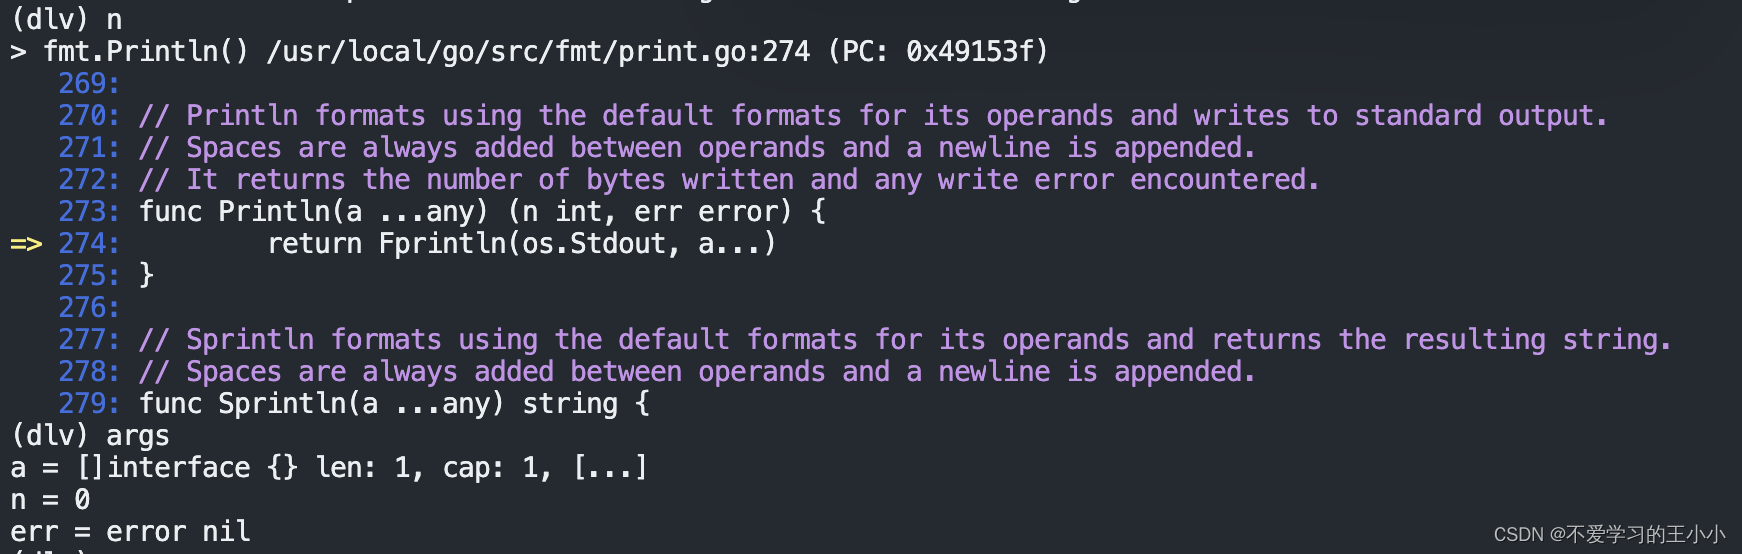
locals
输出本地的变量,就是当前栈上的变量,如图,上面定义了一个a变量类型为interface,值为1。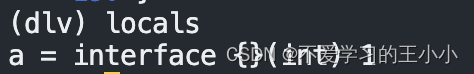
这个可以输出当前环境的变量,比如之前定义的a变量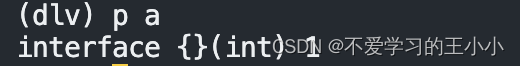
和break可以打go源码包中断点一样,p一样可以输出源码中的变量。
比如这里输出go里面的最大process数量。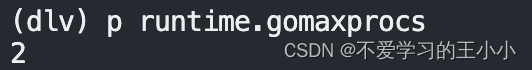
vars
这个是输出当前包下面所有的包变量,包括源码中的变量。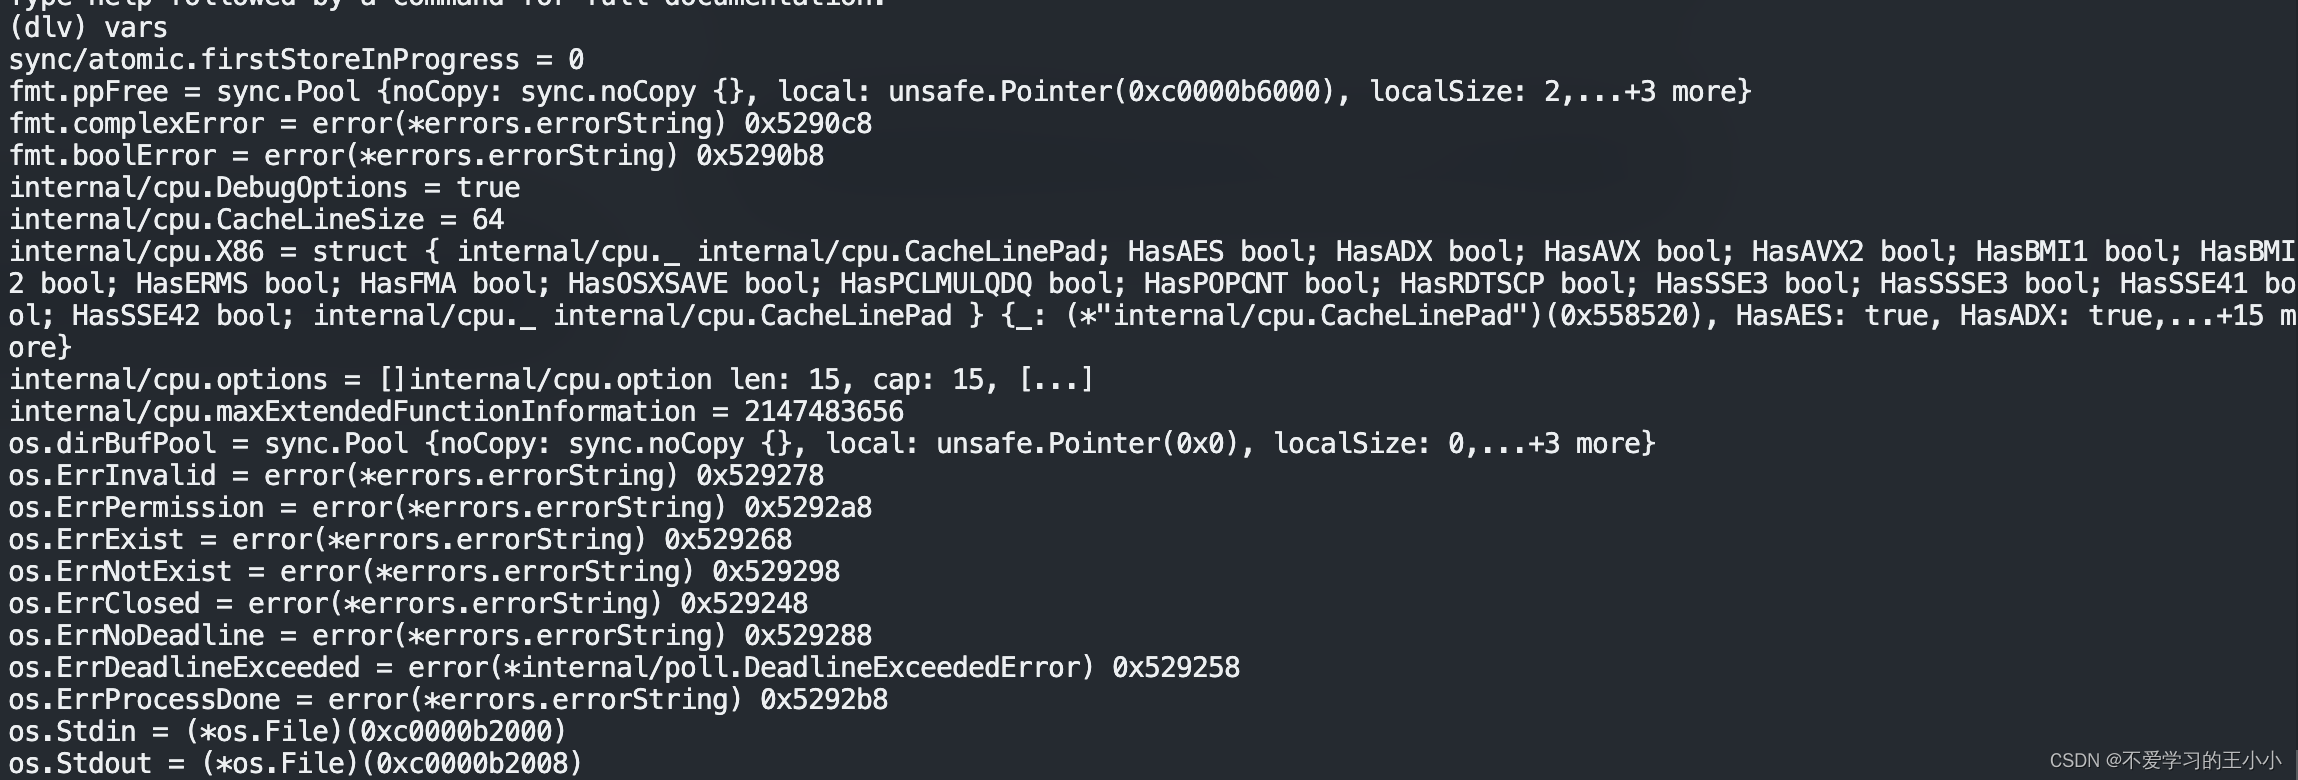
线程切换
Listing and switching between threads and goroutines:
    goroutine (alias: gr) -- Shows or changes current goroutine
    goroutines (alias: grs)  List program goroutines.
    thread (alias: tr) ----- Switch to the specified thread.
    threads ---------------- Print out info for every traced thread.
goroutine
查看或者切换到指定的goroutines.可以看到当前上下文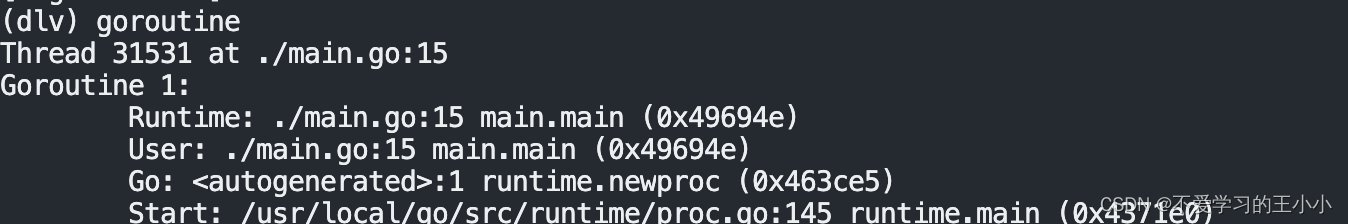
goroutines
可以看到所有的goroutines的所处状态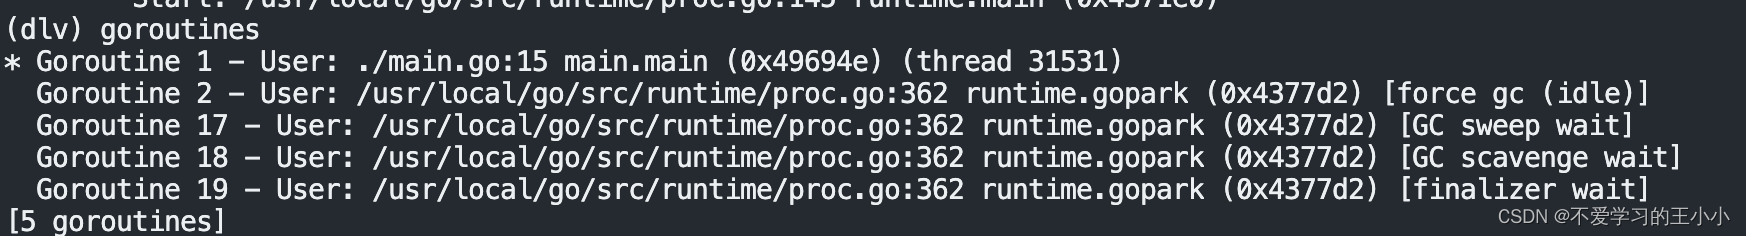
thread
threads
输出线程所处状态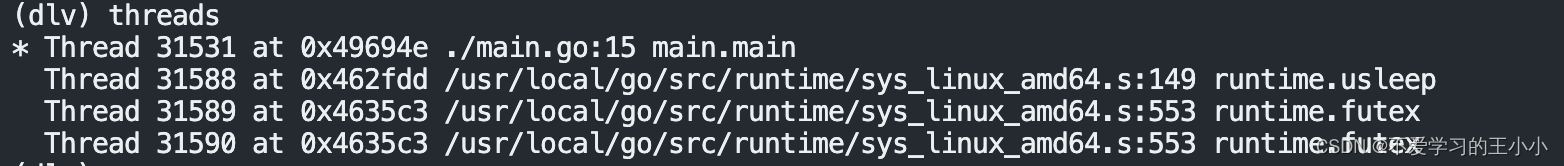
查看堆栈
Viewing the call stack and selecting frames:
    deferred --------- Executes command in the context of a deferred call.
    down ------------- Move the current frame down.
    frame ------------ Set the current frame, or execute command on a different frame.
    stack (alias: bt)  Print stack trace.
    up --------------- Move the current frame up.
stack
这个主要就是为了输出当前的堆栈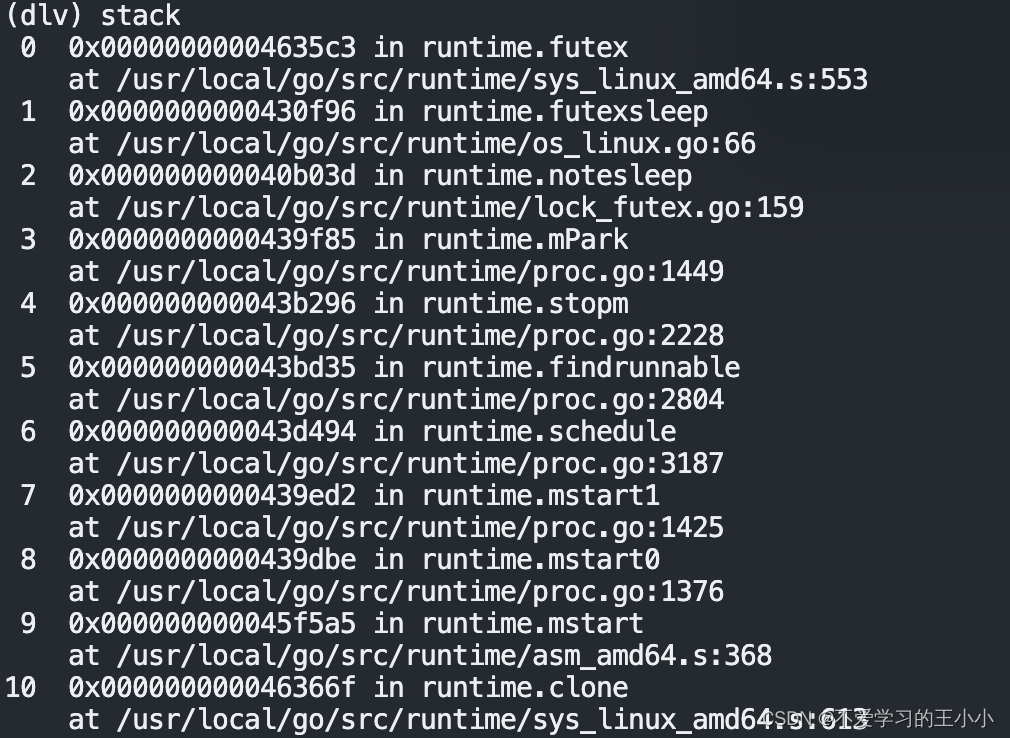
其他命令
Other commands:
    config --------------------- Changes configuration parameters.
    disassemble (alias: disass)  Disassembler.
    dump ----------------------- Creates a core dump from the current process state
    edit (alias: ed) ----------- Open where you are in $DELVE_EDITOR or $EDITOR
    exit (alias: quit | q) ----- Exit the debugger.
    funcs ---------------------- Print list of functions.
    help (alias: h) ------------ Prints the help message.
    libraries ------------------ List loaded dynamic libraries
    list (alias: ls | l) ------- Show source code.
    source --------------------- Executes a file containing a list of delve commands
    sources -------------------- Print list of source files.
    transcript ----------------- Appends command output to a file.
    types ---------------------- Print list of types