最近遇到一个绘制散点图用来做数据分析的需求,正好最近了解过开源图表控件LiveCharts,刚好拿来试一试。
简单实例
新建WPF应用程序,使用NuGet安装LiveCharts.Wpf类库。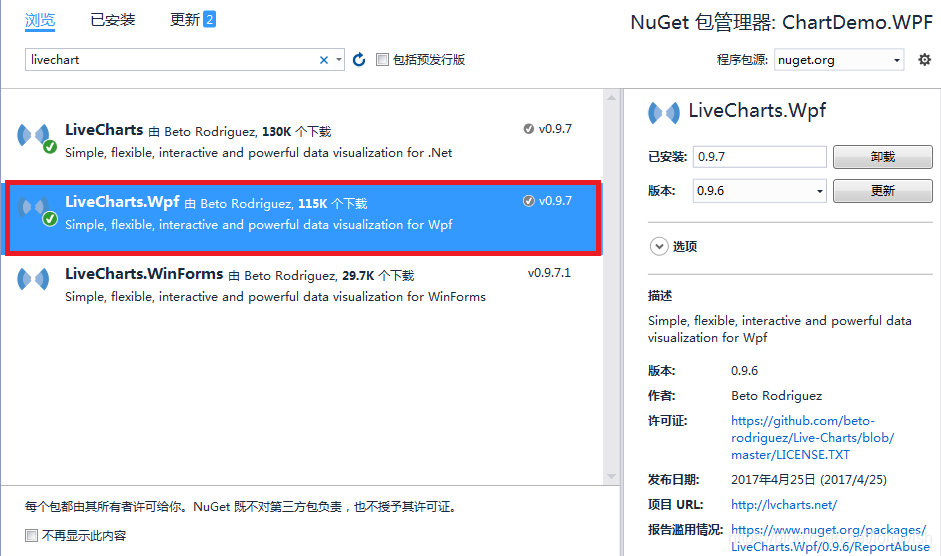
在XAML代码中添加LiveCharts.Wpf的引用并增加一个图表控件。
<Window x:Class="ChartDemo.WPF.MainWindow"
                      xmlns="http://schemas.microsoft.com/winfx/2006/xaml/presentation"
                      xmlns:x="http://schemas.microsoft.com/winfx/2006/xaml"
                   xmlns:lvc="clr-namespace:LiveCharts.Wpf;assembly=LiveCharts.Wpf"
                      Title="MainWindow" Height="720" Width="1280">
    <Grid Margin="5">
        <Grid.RowDefinitions>
            <RowDefinition Height="50"></RowDefinition>
            <RowDefinition></RowDefinition>
        </Grid.RowDefinitions>
        <Border Grid.Row="0">
            <WrapPanel VerticalAlignment="Center" HorizontalAlignment="Center">
                <Button x:Name="btnTest" Click="btnTest_Click">查看图表</Button>
            </WrapPanel>
        </Border>
        <Border Grid.Row="1">
            <lvc:CartesianChart x:Name="lvcChart">
            </lvc:CartesianChart>
        </Border>
    </Grid>
</Window>
最简单的一个图表控件就添加完成了,下面是在后台代码中为图表控件添加数据源。数据源从Excel表格中读取,所以引用了Aspose.Cells用来读取Excel表格。
        private void btnTest_Click(object sender, RoutedEventArgs e)
        {
            System.Windows.Forms.OpenFileDialog dialog = new System.Windows.Forms.OpenFileDialog();
            dialog.Filter = "Excel 2007(*.xlsx)|*.xlsx";
            System.Windows.Forms.DialogResult result = dialog.ShowDialog();
            if (result == System.Windows.Forms.DialogResult.OK)
            {

                try
                {
                    string fileName = dialog.FileName;
                    if (string.IsNullOrEmpty(fileName))
                    {
                        return;
                    }
                    Workbook book = new Workbook(fileName);
                    Worksheet sheet = book.Worksheets[0];
                    Cells cells = sheet.Cells;
                    //初始化数据序列集合
                    SeriesCollection collection = new SeriesCollection();
                    //初始化数据序列
                    ScatterSeries series = new ScatterSeries()
                    {
                        Values = new ChartValues<ScatterPoint>()
                    };
                    for (int i = 1; i < cells.MaxDataRow; i++)
                    {
                        double x = 0;
                        double y = 0;
                        if (cells.GetCell(i, 1) == null || cells.GetCell(i, 2) == null)
                        {
                            continue;
                        }
                        x = cells.GetCell(i, 1).DoubleValue;
                        y = cells.GetCell(i, 2).DoubleValue;
                        ScatterPoint point = new ScatterPoint(x, y);
                        series.Values.Add(point);
                    }
                    collection.Add(series);
                    this.lvcChart.Series = collection;
                }
                catch (Exception ex)
                {
                    MessageBox.Show(ex.Message);
                }
            }
        }
    }
这样一个简单的散点图就完成了,效果如下: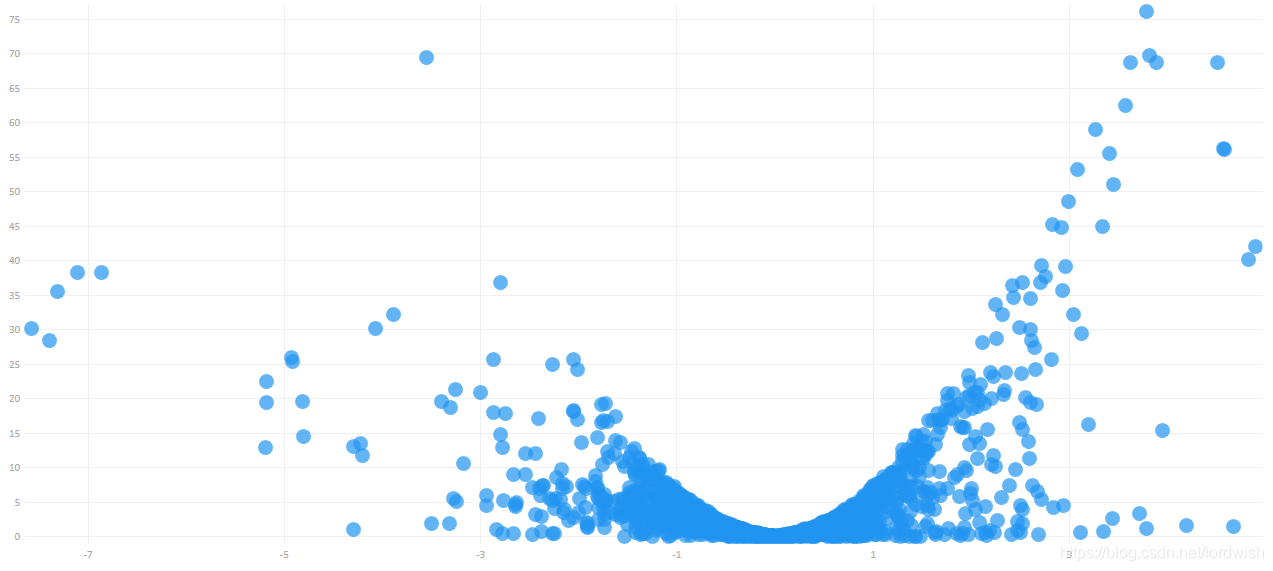
功能进阶
在上一步用很少的代码就实现了图表绘制,但现在的图表未免有些单调了,能否更高级一些呢?
1.对Y值进行划分并显示不同背景
            <lvc:CartesianChart x:Name="lvcChart">
                <lvc:CartesianChart.AxisY>
                    <lvc:Axis>
                        <lvc:Axis.Sections>
                            <!--Value为起始值,SectionWidth为区间长度,Label为区间描述,Fill为区间填充样式-->
                            <lvc:AxisSection Value="4" SectionWidth="16" Label="区间2">
                                <lvc:AxisSection.Fill>
                                    <SolidColorBrush Color="#CDCDCD" Opacity=".4"></SolidColorBrush>
                                </lvc:AxisSection.Fill>
                            </lvc:AxisSection>
                            <lvc:AxisSection Value="0" SectionWidth="4" Label="区间1">
                                <lvc:AxisSection.Fill>
                                    <SolidColorBrush Color="#FF8585" Opacity=".4"></SolidColorBrush>
                                </lvc:AxisSection.Fill>
                            </lvc:AxisSection>
                        </lvc:Axis.Sections>
                    </lvc:Axis>
                </lvc:CartesianChart.AxisY>
            </lvc:CartesianChart>
效果如下: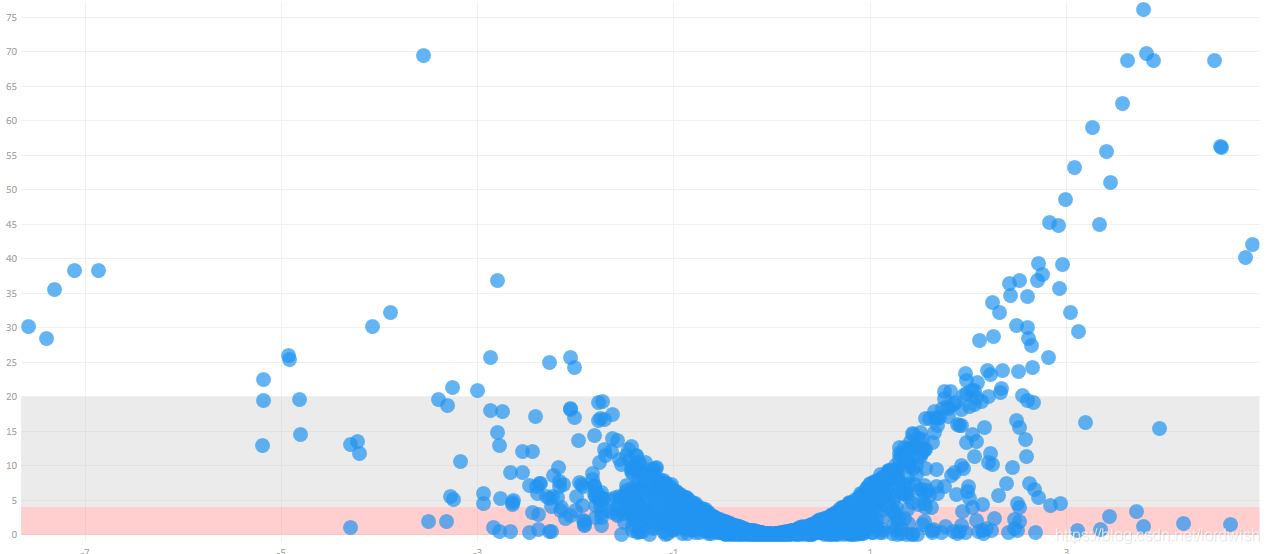
2.同时对X、Y值进行划分并显示不同颜色的点
上一步通过划分Y值区间显示不同的区域背景很容易实现,但如何让不同区间的点显示不同颜色或图形呢?这个就要从数据上着手,在后台代码中事先将不同的区间的值放到不同的数据序列中,然后赋予数据序列不同的形状和颜色。
private void btnTest_Click(object sender, RoutedEventArgs e)
{
    System.Windows.Forms.OpenFileDialog dialog = new System.Windows.Forms.OpenFileDialog();
    dialog.Filter = "Excel 2007(*.xlsx)|*.xlsx";
    System.Windows.Forms.DialogResult result = dialog.ShowDialog();
    if (result == System.Windows.Forms.DialogResult.OK)
    {
        try
        {
            string fileName = dialog.FileName;
            if (string.IsNullOrEmpty(fileName))
            {
                return;
            }
            Workbook book = new Workbook(fileName);
            Worksheet sheet = book.Worksheets[0];
            Cells cells = sheet.Cells;
            SeriesCollection collection = new SeriesCollection();
            ScatterSeries seriesLeft = new ScatterSeries()
            {
                Values = new ChartValues<ScatterPoint>(),
                PointGeometry = DefaultGeometries.Square,
                Fill = new SolidColorBrush(Colors.OrangeRed)
            };
            ScatterSeries seriesRight = new ScatterSeries()
            {
                Values = new ChartValues<ScatterPoint>(),
                Fill = new SolidColorBrush(Colors.LimeGreen)
            };
            ScatterSeries seriesBottom = new ScatterSeries()
            {
                Values = new ChartValues<ScatterPoint>(),
                PointGeometry = DefaultGeometries.Triangle
            };
            for (int i = 1; i < cells.MaxDataRow; i++)
            {
                double x = 0;
                double y = 0;
                if (cells.GetCell(i, 1) == null || cells.GetCell(i, 2) == null)
                {
                    continue;
                }
                x = cells.GetCell(i, 1).DoubleValue;
                y = (Math.Log10(cells.GetCell(i, 2).DoubleValue)) * (-1);
                if (y > 2 && x < -0.3)
                {
                    ScatterPoint point = new ScatterPoint(x, y);

                    seriesLeft.Values.Add(point);
                }
                else if (y > 2 && x > 3)
                {
                    ScatterPoint point = new ScatterPoint(x, y);
                    seriesRight.Values.Add(point);
                }
                else
                {
                    ScatterPoint point = new ScatterPoint(x, y);
                    seriesBottom.Values.Add(point);
                }
            }
            collection.Add(seriesLeft);
            collection.Add(seriesRight);
            collection.Add(seriesBottom);
            this.lvcChart.Series = collection;
        }
        catch (Exception ex)
        {
            MessageBox.Show(ex.Message);
        }
    }
}
效果如下图所示: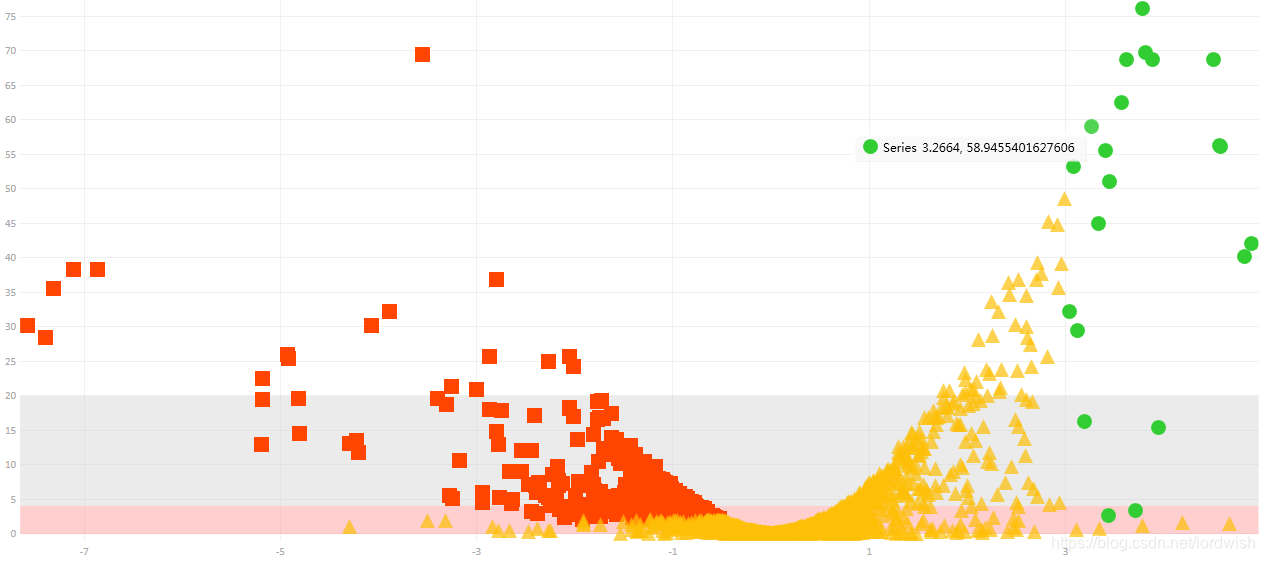
以上只是LiveCharts的一部分功能,更多的功能可以到官网去探索。对比以前用过的WPF图表控件vsfire、ModernUIChart和DevExpress,界面好过vsfire但缺少保存图片的功能,界面与MordenUIChart相当但是图表类型稍微丰富些,功能不如DevExpress丰富但是开源啊。
各有千秋,选择合适的就好。
版权声明:本文为lordwish原创文章,遵循CC 4.0 BY-SA版权协议,转载请附上原文出处链接和本声明。