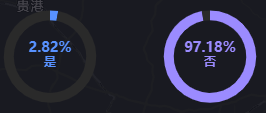
html部分,echarts图示根据id在找到要绘画的位置,这里v-for循环出来两个id就可以画两个echarts图。
<div v-for="(item,i) in xxxx" :key="i">
  <div :id="`chart_${i}`"></div>
</div>
js部分,绘画echarts图的是写在一个方法里面的。
loadCharts() {
  const V = this;
  V.xxxx.forEach((item,i) => {
  const chart = V.$echarts.init(document.getElementById(`chart_${i}`));
  chart2.setOption({
    title: {
      text: item.percer,
      left: "center",
      top: "40%",
      textStyle: {
        color: item.color,
        fontSize: 14,
        align: "center"
      }
    },
    graphic:{
      type:"text",
      left:"center",
      top:"55%",
      style:{
        text: item.name,
        textAlign: "center",
        fill:item.color,
        fontSize:12,
        fontWeight:1000
      }
    },
    tooltip: {
      show: false,
      trigger: 'item'
    },
    color:[item.color,'#2a2a2a'],

    series: [
      {
        name: '访问来源',
        type: 'pie',
        radius: ['55%', '70%'],
        center: ['50%', '55%'],
        avoidLabelOverlap: false,
        hoverAnimation: false,
        label: {
          show: false,
          position: 'center'
        },
        labelLine: {
          show: false
        },
        data: [
          {value: item.value, name: item.name},
          {value: sum - item.value, name:''},
        ],
      }
    ]
  });
  window.addEventListener('resize', function () {
    chart.resize();
  });
})
}
版权声明:本文为hh994原创文章,遵循CC 4.0 BY-SA版权协议,转载请附上原文出处链接和本声明。