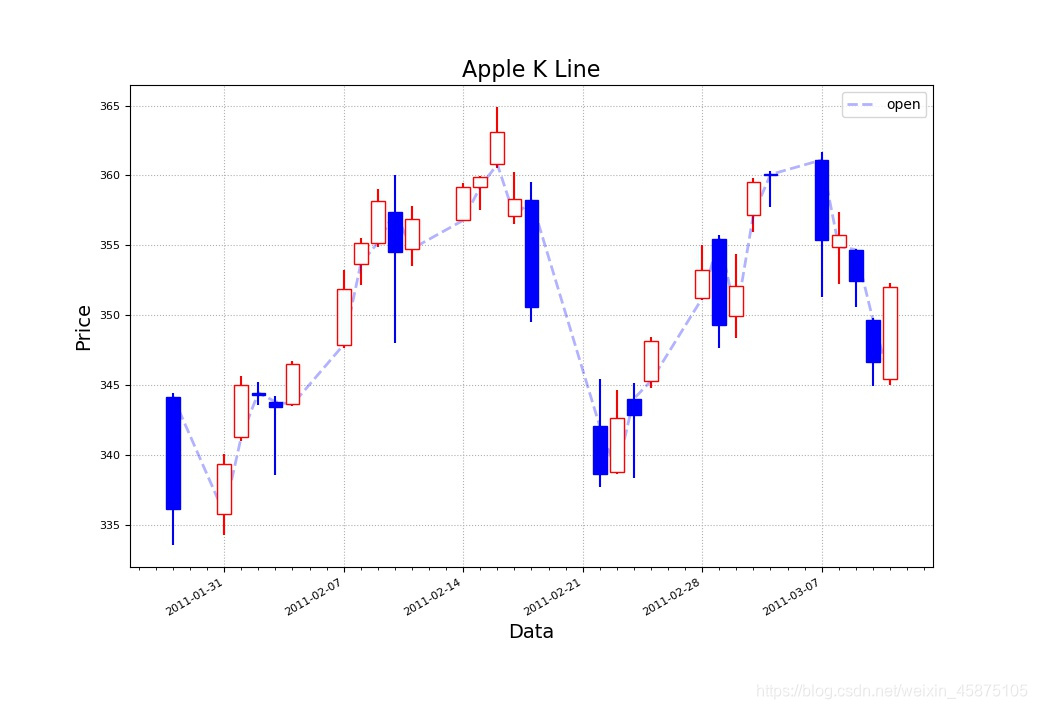
python matplotlib 绘制K线图(蜡烛图)
csv文件下载地址:
链接:https://pan.baidu.com/s/1EvDxEPuIS8zAseLRO1SDBQ
提取码:lb0t
"""
    绘制蜡烛图
"""

import numpy as np
import datetime as dt
import matplotlib.pyplot as mp
import matplotlib.dates as md


# 方法-日期转换函数
def dmy2ymd(dmy):
    dmy = str(dmy, encoding='utf-8')
    time = dt.datetime.strptime(dmy, '%d-%m-%Y').date()
    t = time.strftime('%Y-%m-%d')
    return t


# 1.读取csv文件数据
dates, open_price, max_price, min_price, close_price, volumes = np.loadtxt(
    r".\aapl.csv",
    delimiter=",",
    usecols=(1, 3, 4, 5, 6, 7),
    unpack=True,
    dtype="M8[D], f8, f8, f8, f8, f8",
    converters={1: dmy2ymd})

print(open_price)

# 2.设置绘图窗口
mp.figure("Apple K Line", facecolor="lightgray")
mp.title("Apple K Line", fontsize=16)
mp.xlabel("Data", fontsize=14)
mp.ylabel("Price", fontsize=14)

# 3.x坐标(时间轴)轴修改
ax = mp.gca()
# 设置主刻度定位器为周定位器(每周一显示主刻度文本)
ax.xaxis.set_major_locator(md.WeekdayLocator(byweekday=md.MO))
ax.xaxis.set_major_formatter(md.DateFormatter('%Y-%m-%d'))
ax.xaxis.set_minor_locator(md.DayLocator())

mp.tick_params(labelsize=8)
mp.grid(linestyle=":")

# 4.判断收盘价与开盘价 确定蜡烛颜色
colors_bool = close_price >= open_price
colors = np.zeros(colors_bool.size, dtype="U5")
colors[:] = "blue"
colors[colors_bool] = "white"

# 5.确定蜡烛边框颜色
edge_colors = np.zeros(colors_bool.size, dtype="U1")
edge_colors[:] = "b"
edge_colors[colors_bool] = "r"

# 绘制开盘价折线图片
dates = dates.astype(md.datetime.datetime)
mp.plot(dates, open_price, color="b", linestyle="--",
        linewidth=2, label="open", alpha=0.3)

# 6.绘制蜡烛
mp.bar(dates, (close_price - open_price), 0.8, bottom=open_price, color=colors,
       edgecolor=edge_colors, zorder=3)

# 7.绘制蜡烛直线(最高价与最低价)
mp.vlines(dates, min_price, max_price, color=edge_colors)

mp.legend()
mp.gcf().autofmt_xdate()
mp.show()
版权声明:本文为weixin_45875105原创文章,遵循CC 4.0 BY-SA版权协议,转载请附上原文出处链接和本声明。