系统环境
系统环境:CentOS-7-x86_64-Minimal-1708
关闭防火墙与selinux
关闭防火墙
systemctl stop firewalld && systemctl disable firewalld
关闭selinux
sed -i 's/SELINUX=enforcing/SELINUX=disabled/' /etc/selinux/config
然后重启reboot
替换阿里云Zabbix源
shell脚本zabbix_aliyun.sh
vi zabbix_aliyun.sh
复制下面脚本
#!/bin/bash
echo -e "请给出要安装的zabbix版本号,建议使用4.x的版本 \033[31musage:./zabbix_aliyun.sh 4.0|4.4|4.5|5.0 \033[0m"
echo "例如要安装4.4版本,在命令行写上 ./zabbix_aliyun.sh 4.4"
if [ -z $1 ];then
exit
fi
VERSION=$1
if [ -f /etc/yum.repos.d/zabbix.repo ];then
rm -rf /etc/repos.d/zabbix.repo
fi
rpm -qa | grep zabbix-release && rpm -e zabbix-release
rpm -Uvh https://mirrors.aliyun.com/zabbix/zabbix/$VERSION/rhel/7/x86_64/zabbix-release-$VERSION-1.el7.noarch.rpm
sed -i "s@zabbix/.*/rhel@zabbix/$VERSION/rhel@g" /etc/yum.repos.d/zabbix.repo
sed -i 's@repo.zabbix.com@mirrors.aliyun.com/zabbix@g' /etc/yum.repos.d/zabbix.repo
[ $? -eq 0 ] && echo "阿里云的zabbix源替换成功" || exit 1
yum clean all
yum makecache fast
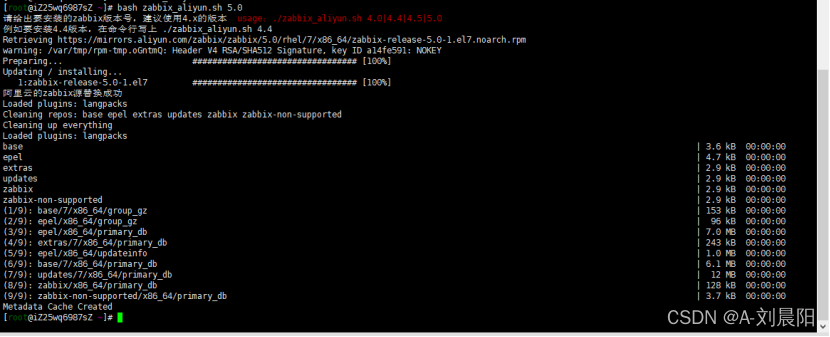
然后执行命令:
bash zabbix_aliyun.sh 5.0
由于zabbix提供集中的web监控管理界面,因此服务在web界面的呈现需要LAMP架构支持。安装httpd php
yum install -y httpd php php-mysql php-gd libjpeg* php-ldap php-odbc php-pear php-xml php-xmlrpc php-mhash
安装常用的开发软件
yum groups install "Development Tools"
查看工具包
yum groups info "Development Tools"
安装zabbix5.0仓库
wget --no-check-certificate https://repo.zabbix.com/zabbix/5.0/rhel/7/x86_64/zabbix-release-5.0-1.el7.noarch.rpm
rpm -ivh zabbix-release-5.0-1.el7.noarch.rpm
yum clean all

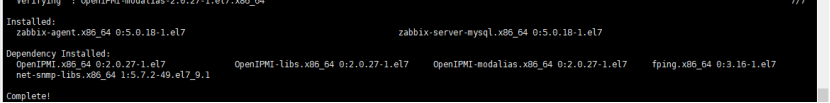
安装zabbix server 和agent
yum install zabbix-server-mysql zabbix-agent -y
启用Red Hat软件集合
SCL(Software Collections)可以让你在同一个操作系统上安装和使用多个版本的软件,而不会影响整个系统的安装包。
yum install centos-release-scl -y

启用zabbix-deprecated repository
vi /etc/yum.repos.d/zabbix.repo [zabbix-frontend] enabled=1
安装zabbix前端
yum install -y zabbix-web-mysql-scl zabbix-apache-conf-scl
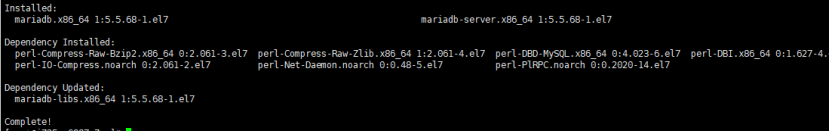
安装mysql数据库
yum -y install mariadb-server mariadb
启动mariadb
systemctl start mariadb&&systemctl enable mariadb
启动mysql后执行初始化安全设置
#设置mysql密码为123456
mysqladmin -u root password "123456"
创建数据库
#进入mysql
mysql -uroot -p #输入密码123456
#创建数据库,格式为utf8
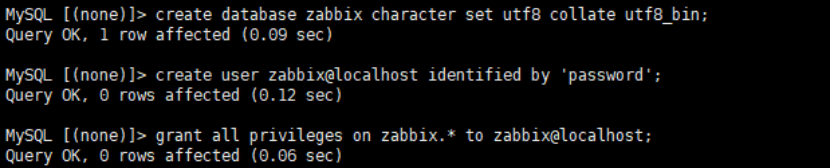
create database zabbix character set utf8 collate utf8_bin;
#创建用户
create user zabbix@localhost identified by 'password'; #密码是password,导入Zabbix数据库结构和数据输入这个密码
#给zabbix用户权限
grant all privileges on zabbix.* to zabbix@localhost;
#退出
quit;
在Zabbix服务器主机上,导入初始架构和数据。系统将提示您输入新创建的密码
zcat /usr/share/doc/zabbix-server-mysql*/create.sql.gz | mysql -uzabbix -p zabbix #回车密码是password
为zabbix服务器配置数据库
vi /etc/zabbix/zabbix_server.conf
DBPassword=password
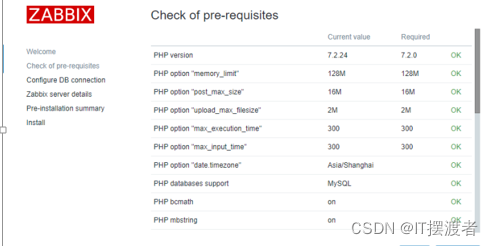
为Zabbix前端配置PHP
编辑文件/etc/opt/rh/rh-php72/php-fpm.d/zabbix.conf,取消注释并为您设置正确的时区。
#进入zabbix配置
vi /etc/opt/rh/rh-php72/php-fpm.d/zabbix.conf
#找到这行配置地区
php_value[date.timezone] = Asia/Shanghai
直接使用IP地址访问
vim /etc/httpd/conf/httpd.conf
操作步骤:
1、修改httpd.conf配置
vi /etc/httpd/conf/httpd.conf
2、找到DocumentRoot那一行,将其注释掉,新增一行指向zabbix。
#DocumentRoot "/var/www/html"
DocumentRoot "/usr/share/zabbix"
3、重启服务
systemctl restart httpd
systemctl restart zabbix-server
启动zabbix服务
systemctl restart zabbix-server zabbix-agent httpd rh-php72-php-fpm&&systemctl enable zabbix-server zabbix-agent httpd rh-php72-php-fpm
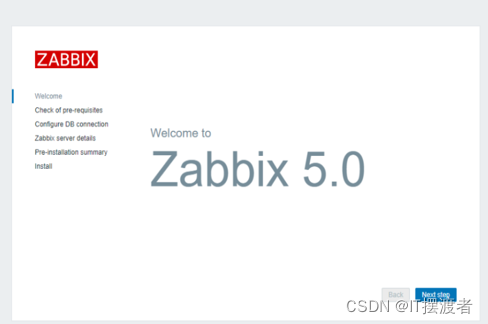
配置Zabbix Web前端
浏览器输入http://ip/zabbix,Zabbix
初始用户名:Admin,初始密码为:zabbix
点next step下一步
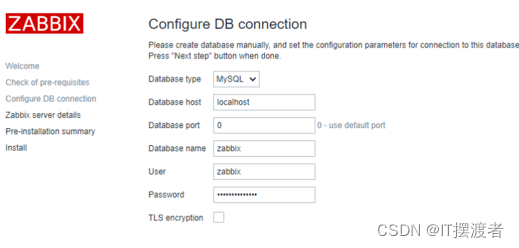
配置mysql数据库账号和密码, 输入zabbix帐户的密码,点next step下一步
Name那里起一个名, 点next step下一步
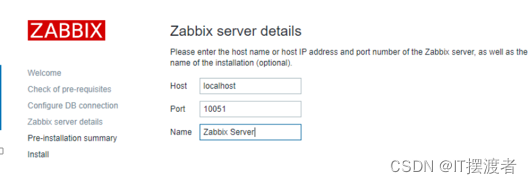
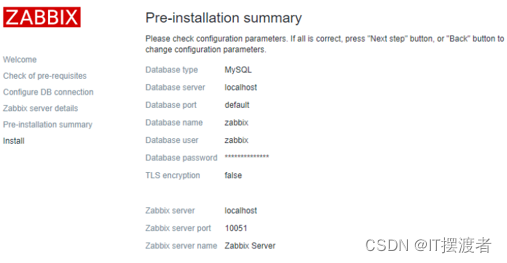
至此zabbix前端配置完成
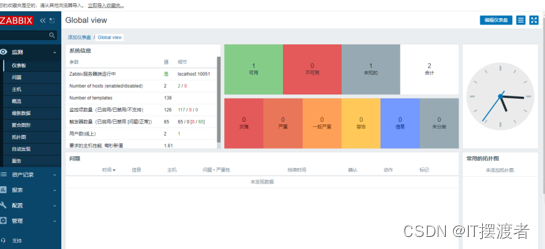
输入账号Admin密码zabbix

进入zabbix页面
后续配置zabbix页面语言为中文
1.Zabbix前端界面设置成中文
选择User settings,语言选择中文,点击update
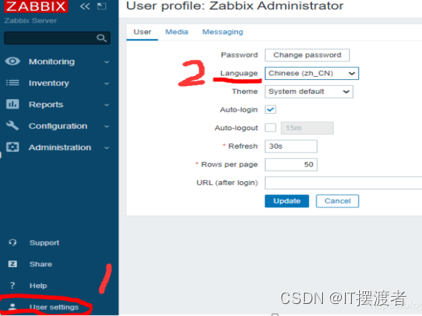
就修改成功了,同时zabbix也就部署完成了。
grafana稳定版_grafana的安装与设置
初酿乖乖
于 2021-01-26 23:56:58 发布
900
收藏 1
文章标签: grafana稳定版
版权
zabbix3.4.9和grafana5.1.3的整合
本次介绍两种安装方法,其他的方法请查看官方文档:
第一种:直接rpm下载安装稳定版
sudo yum install https://s3-us-west-2.amazonaws.com/grafana-releases/release/grafana-5.1.3-1.x86_64.rpm
第二种:可以安装到最新稳定版(CentOS7)
$ wget https://s3-us-west-2.amazonaws.com/grafana-releases/release/grafana-5.1.3-1.x86_64.rpm
$ sudo yum install initscripts fontconfig
$ sudo rpm-Uvh grafana-5.1.3-1.x86_64.rpm
2、安装服务端图像呈现组件
yum install fontconfig
yum install freetype*yum install urw-fonts
3、启动服务
systemctl daemon-reload
systemctl start grafana-server
systemctl status grafana-server
systemctl enable grafana-server.service
或/etc/init.d/grafana-server start
方式启动服务
安装信息
安装二进制文件 /usr/sbin/grafana-server
init.d脚本/etc/init.d/grafana-server
默认文件(环境变量)/etc/sysconfig/grafana-server
配置文件/etc/grafana/grafana.ini
systemd服务(如果systemd可用)名称 grafana-server.service
默认配置使用一个日志文件/var/log/grafana/grafana.log
默认配置指定一个sqlite3数据库/var/lib/grafana/grafana.db
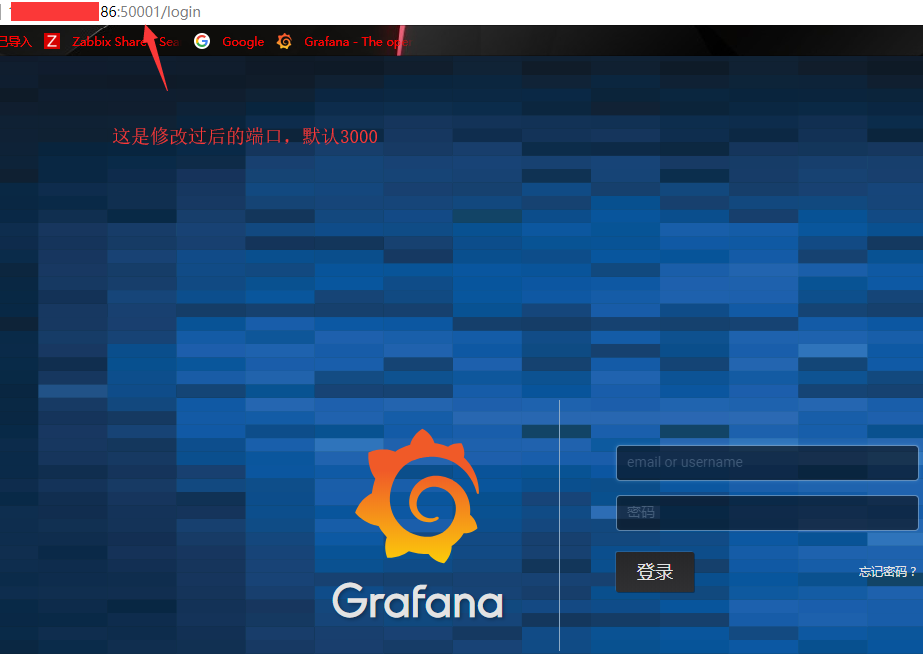
4、结果测试:
地址:http://ServerIP:3000(默认端口) 默认登录用户名密码:admin/admin
基本设置:
1、结合zabbix实现可视化图形监控
1.1、获取可用插件列表
grafana-cli plugins list-remote
[root@zabbix-server ~]#grafana-cli plugins list-remote
id: abhisant-druid-datasource version: 0.0.5id: alexanderzobnin-zabbix-app version: 3.9.1id: ayoungprogrammer-finance-datasource version: 1.0.0id: belugacdn-app version: 1.2.0id: bessler-pictureit-panel version: 1.0.0id: blackmirror1-singlestat-math-panel version: 1.0.0id: blackmirror1-statusbygroup-panel version: 1.1.1id: bosun-app version: 0.0.28id: briangann-datatable-panel version: 0.0.6id: briangann-gauge-panel version: 0.0.6id: btplc-alarm-box-panel version: 1.0.6id: btplc-peak-report-panel version: 0.2.3id: btplc-status-dot-panel version: 0.2.3id: btplc-trend-box-panel version: 0.1.8id: camptocamp-prometheus-alertmanager-datasource version: 0.0.5......
1.2、安装grafana-zabbix、grafana-clock-panel插件
grafana-cli plugins install alexanderzobnin-zabbix-app
grafana-cli plugins install grafana-clock-panel
1.3、重启grafana服务
/etc/init.d/grafana-server restart
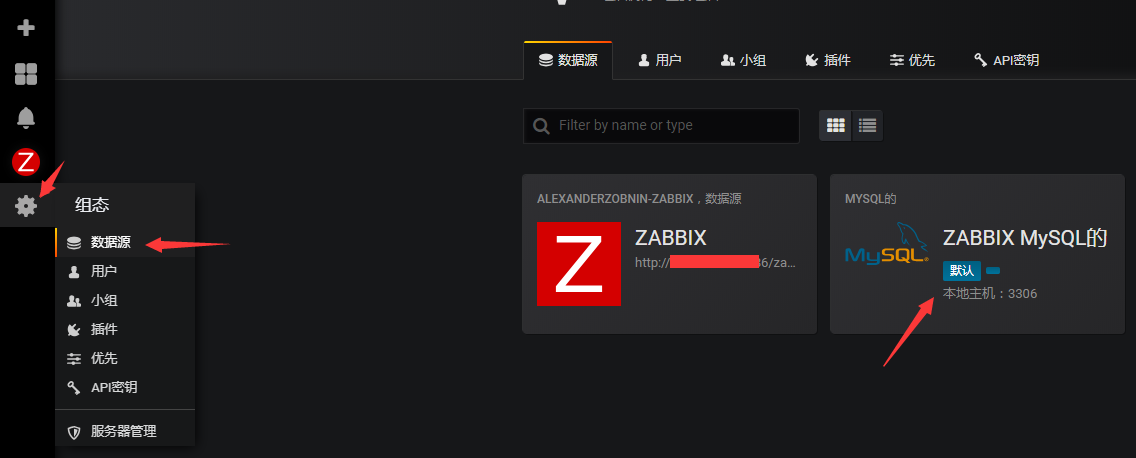
2、网站管理控制台启用zabbix插件
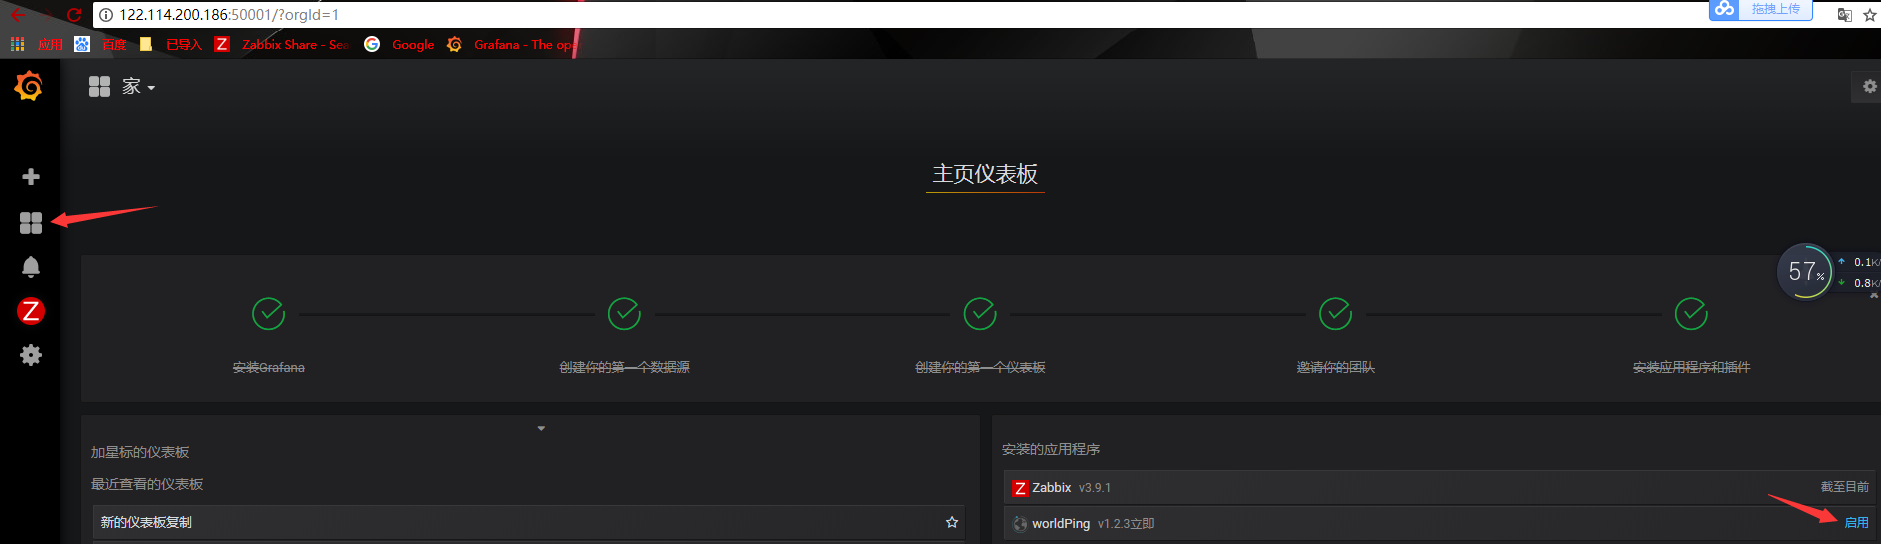
2.1、设置源数据