主成分分析 独立成分分析
Unsupervised machine learning has always been used to work very closely with supervised machine learning algorithms and one of the most popular unsupervised learning technique has been Principal Component analysis, why it is extremely popular is because of its ability to process our independent set of variables in such a manner where we end up with the set of variables which has more insightful information and very little noise.
无监督机器学习一直被用来与有监督机器学习算法非常紧密地合作,最流行的无监督学习技术之一就是主成分分析,之所以如此流行,是因为它能够处理这样的独立变量集一种以变量集结束的方式,该变量集具有更深入的信息,并且噪音很小。
Now with less noise and reduced dimensions, the data set becomes extremely lightweight, can be visualized better, and can be processed better by our ML models with very little overfitting. That’s why PCA is the darling of most of the data engineers who have this role of analyzing the data to reduce the cost of data processing by our machines in the cloud both in terms of speed and storage.
现在,噪声降低了,尺寸减小了,数据集变得非常轻便,可以更好地可视化,并且可以用我们的ML模型进行很好的拟合,而几乎没有过度拟合的情况。 这就是为什么PCA是大多数数据工程师的宠儿,他们担负着分析数据的角色,以降低我们的计算机在云计算方面的速度和存储成本。
“Time saved is money saved for the industry , which PCA handles very diligently “
“节省的时间就是为该行业节省的钱,PCA非常努力地处理了这一问题”
So with this wisdom at our disposal, it’s time to uncover this extremely powerful machine learning tool called PCA.
因此,有了我们的这种智慧,该是时候发现这种功能强大的机器学习工具PCA了。
什么是PCA? (What Is PCA?)
It is an unsupervised ML tool to reduce the dimensionality of the large data set having large numbers of independent variables with collinearity/correlation among themselves.
这是一种无监督的ML工具,用于减少具有大量自变量且彼此之间具有共线性/相关性的大型数据集的维数。
PCA in others terms is used for Dimensionality reduction by reducing noise in the given independent variables.
换句话说,PCA用于通过减少给定自变量中的噪声来降低尺寸。
One has to understand how dimensionality reduction works before one can really assess how valuable PCA can be in the field of Unsupervised learning, so let’s get into the details of “Dimensionality Reduction “
在真正评估PCA在无监督学习领域中的价值之前,必须先了解降维的工作原理,因此让我们深入了解“ 降维”
什么是降维及其如何工作? (What is Dimensionality Reduction & How Does It Work?)
Dimensions here stand for all the column values present in our dataframe, and when it comes to reducing those columns we only use the independent features. So the technique of getting rid of those independent variables is called Dimensionality reduction.
维度代表数据框中所有列的值,当涉及减少这些列时,我们仅使用独立功能。 因此,消除这些自变量的技术称为降维。
如何实现降维? (How Dimensionality Reduction Is Achieved?)
Dimensionality reduction is achieved using two of the below-given techniques
使用以下两种技术实现降维
Feature Elimination
功能消除
Feature Extraction
特征提取
功能消除: (Feature Elimination :)
It’s a simple but very harsh method of getting rid of those feature columns which doesn’t look important through the analysis.
这是一种简单但非常苛刻的方法,用于消除那些在分析中看起来并不重要的要素列。
坏处: (Disadvantage:)
- The very obvious disadvantage of this methodology is that we will simply lose all the valuable information that a particular feature has to offer, which can be of prime importance. So in professional setup preferably this is the least used mechanism to reduce dimensions of the data set.这种方法的一个非常明显的缺点是,我们将简单地丢失特定功能必须提供的所有有价值的信息,这可能是最重要的。 因此,在专业设置中,最好是使用最少的机制来减少数据集的尺寸。
消除特征的优势: (Advantage of Feature Elimination :)
- It is easy to interpret这很容易解释
- It gives a high level of accuracy but at the cost of model overfitting它提供了很高的精度,但以模型过度拟合为代价
特征提取 : (Feature Extraction :)
In Feature extraction, intuition is to capture or extract meaningful information from the existing set of features and create a new set of feature column which ensure all the valuable info is retained and all the noises are eliminated.
在特征提取中,直觉是从现有特征集中捕获或提取有意义的信息,并创建一组新的特征列,以确保保留所有有价值的信息并消除所有噪声。
Now that you understand the concept of dimensionality reduction, it’s time to understand the role of PCA . When it comes to extracting meaningful information from our feature variable, PCA is our way to go.
现在您已经了解了降维的概念,是时候了解PCA的作用了。 从特征变量中提取有意义的信息时,PCA是我们的最佳选择。
PCA is the tool to do feature extraction in careful and intelligent way
PCA是以谨慎和智能的方式进行特征提取的工具
These extracted features are then generally used in our supervised or deep learning models to make the required predictions.
这些提取的特征随后通常用于我们的监督或深度学习模型中,以进行所需的预测。
降维如何工作? (How Does Dimensionality Reduction Work?)
It works on identifying the highly correlated variables and try to combine them into a new set of features or by completely eliminating them, thereby reducing the multi-collinearityamong those independent columns.
它致力于识别高度相关的变量,并尝试将它们组合为一组新功能或通过完全消除它们,从而减少这些独立列之间的多重共线性 。
降维的优势: (Advantages Of Dimensionality Reduction :)
- This helps in enhanced model performance这有助于增强模型性能
- Decreases the computation time of the model eventually helping the model to converge faster.减少模型的计算时间,最终帮助模型更快收敛。
- With a reduced set of dimensions, now data visualization becomes very super easy通过减少尺寸集,现在数据可视化变得非常容易
- The required storage memory reduces considerably, so the cost for the companies to store those data sets gets reduced significantly所需的存储内存大大减少,因此公司存储这些数据集的成本大大降低了
It treats the anomaly of the “curse of dimensionally“
它处理“ 尺寸诅咒 ”的异常
- Reduces the model overfitting减少模型过度拟合
“ PCA可帮助您了解在不完全消除可用功能变量的情况下必须保留哪些有价值的信息以及需要释放哪些噪声” (“PCA helps you understand what are the valuable information which one has to retain and what are the noises that one needs to let go without completely eliminating the feature variables available ”)
PCA如何工作,PCA的直觉是什么? (How Does PCA Works, What’s The Intuition Behind PCA?)
The main idea behind PCA is to project the independent features in a lower dimension in such a way that they end up explaining the maximum variance in the given data. The intuition here is not to eliminate but to synthesize a new set of features called principal from the existing set of variables in such a manner that they end up being projected in the direction where there is maximum variance.
PCA背后的主要思想是以较低的维度投影独立要素,以使它们最终解释给定数据中的最大方差。 直觉不是要消除而是要从现有变量集中合成一组新的称为主体的特征,以使这些特征最终朝最大方差的方向投影。
让我们了解主成分分析的工作原理: (Let’s understand the working of Principal Component Analysis :)
Let’s visualize the process of PCA.
让我们可视化PCA的过程。
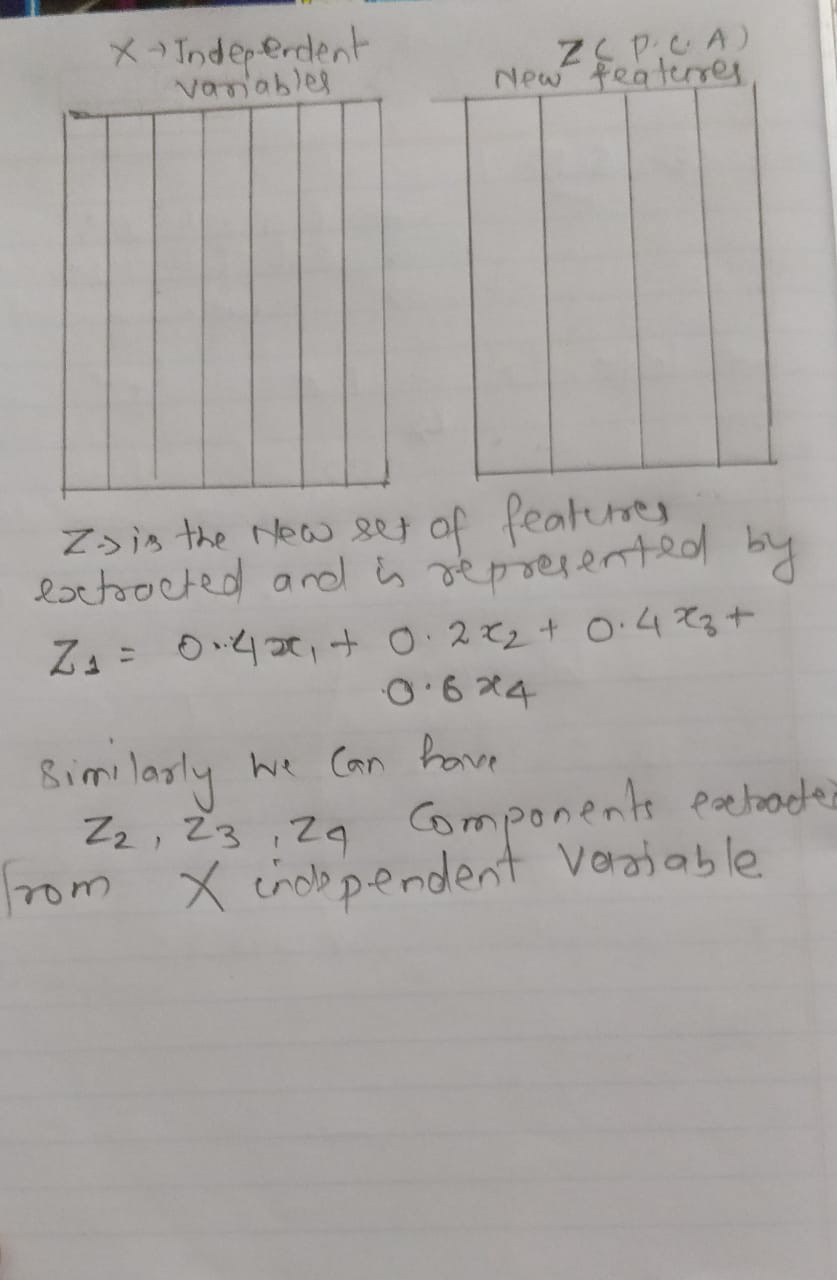
- Suppose we have X independent features shown in the image at the left.假设我们有X个独立特征,如左图所示。
- These have 8 number of columns, where it has variables with collinearity. Represented as X1, X2, X3, X4, X5 etc….它们具有8列数,其中具有具有共线性的变量。 表示为X1,X2,X3,X4,X5等。
- So through PCA, we will extract a new feature variable called Z, which has the PCA components being represented as Z1, Z2, Z3, etc…因此,通过PCA,我们将提取一个名为Z的新特征变量,其中的PCA组件分别表示为Z1,Z2,Z3等。
- So after we performed our PCA we get the linear equations of Principal components like Z1, as can be seen in the image at the left.因此,在执行PCA之后,我们得到了主分量的线性方程式,例如Z1,如左图所示。
- Z1, Z2, Z3, etc are the linear equations that have the coefficient and the data set extracted from x1, x3, x3 independent variables.Z1,Z2,Z3等是线性方程,具有从x1,x3,x3自变量提取的系数和数据集。
- Here i have tried to give you the intuition of how PCA is performed at the very high level, in-fact there goes a lot of algebraic arithmetic process behind to get to those principal components, which we will cover going forward.在这里,我试图向您介绍PCA如何在很高的水平上执行,实际上,后面还有许多代数运算过程可以到达这些主要组成部分,我们将继续介绍这些内容。
可视化PCA: (Visualizing the PCA :)
PCA assumes that the directions with the largest variances are the most important or the most principal
PCA假设方差最大的方向是最重要或最主要的方向
让我们按照下面的无花果2.0来可视化PCA的功能: (Let’s follow the fig 2.0 below and visualize how PCA functions :)
Suppose we have 2 Dimensional independent variable X1 & X2. Have used only 2D data set to explain the PCA with the required visualization and simplicity. In the Plot1 section of fig 2.0, we can see that x1 and x2 variables have been represented with an ellipsoid kind of image where features X1 & X2 are having a positive correlation.
假设我们有2维自变量X1和X2。 仅使用2D数据集以所需的可视化和简单性来解释PCA。 在图2.0的Plot1部分中,我们可以看到x1和x2变量已经用椭圆形的图像表示,其中特征X1和X2具有正相关。
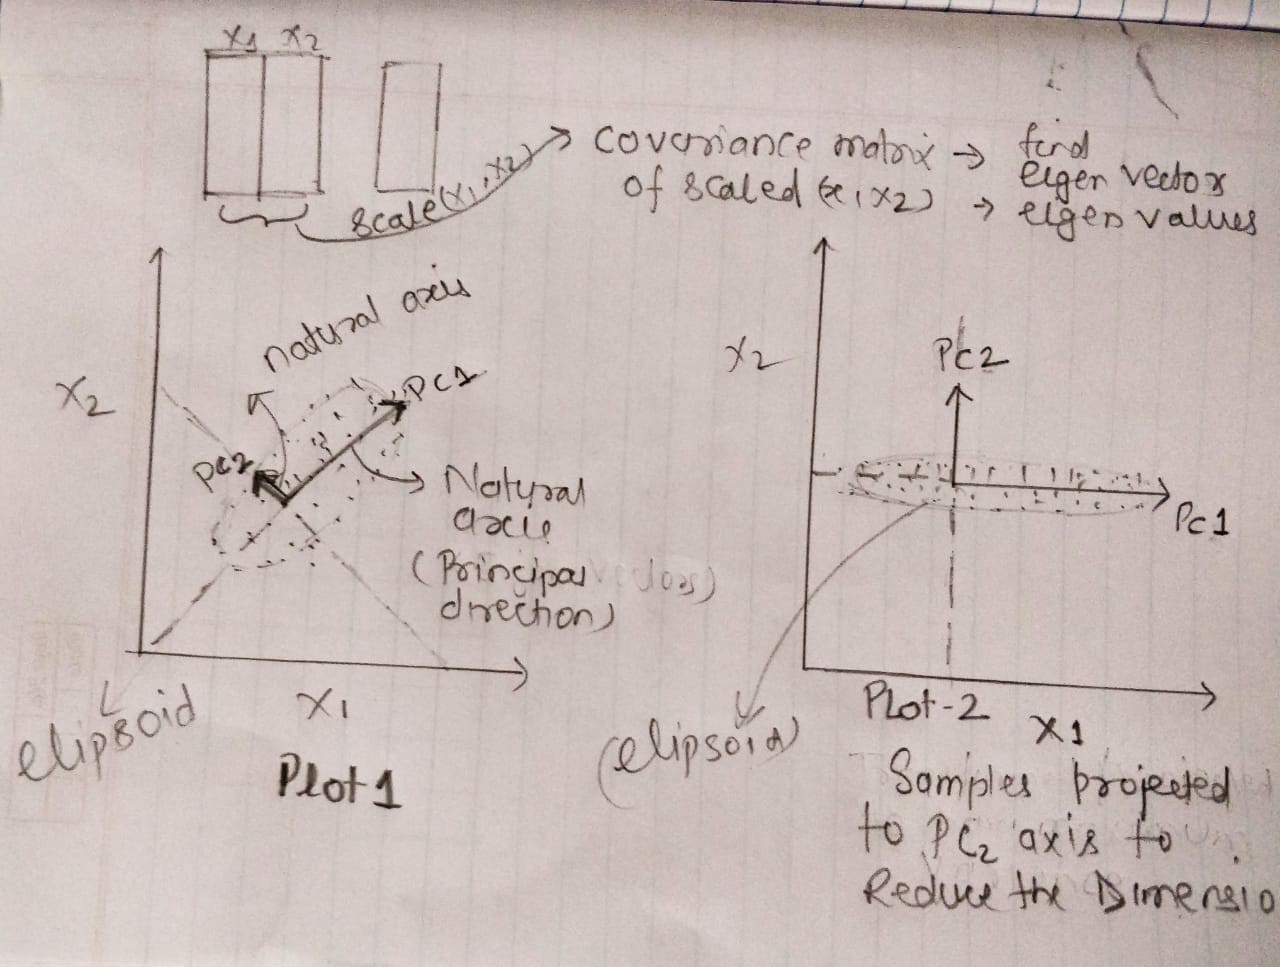
Here PC1 axis is the natural axis or we can say the first principal direction along which our independent variable samples will show the largest variance. Similarly, the PC2 axis is the second most important principle direction with considerable variance.
这里PC1轴是自然轴,或者我们可以说我们的自变量样本将显示最大方差的第一个主方向。 同样,PC2轴是第二重要的主要方向,并且有很大的差异。
In order to reduce the 2 dimension data, we need to transform or project the PC2 axis data set onto the PC1 axis, which has the largest variance to capture. which you can see in plot 2 , where we have projected each data sample to the PC2 axis. Thus we will be able to reduce the features from 2D to 1D. These projected samples form the principal components which have the Eigenvaluesexplaining the largest variance.
为了减少二维数据,我们需要将PC2轴数据集转换或投影到PC1轴上,该PC1轴具有最大的变化要捕获。 您可以在图2中看到该图,其中我们已将每个数据样本投影到PC2轴上。 这样我们就可以将特征从2D减少到1D。 这些投影样本构成了主要特征 ,这些特征具有解释最大方差的特征值 。
Now that we have high-level intuition of how PCA works let’s get into the details of the same.
现在,我们对PCA的工作原理有了一个高层次的直观认识,让我们深入研究一下PCA的细节。
PCA:实施步骤: (PCA: Implementation Steps:)
答:规范化数据集: (A: Normalizing The Data Set:)
In the first step, we need to normalize the data that we have so that PCA works properly. This is done by subtracting the respective means from the numbers in the respective column. So if we have two dimensions X and Y, all X become ?- and all Y become ?-. This produces a dataset whose mean is zero and standard deviation is 1. We can achieve this using sci-kit learn scaling/normalizing methods.
第一步,我们需要规范化我们拥有的数据,以使PCA正常工作。 这是通过从相应列中的数字减去相应的均值来完成的。 因此,如果我们有两个维度X和Y,则所有X都变为?-,所有Y都变为?-。 这将产生一个均值为零且标准偏差为1的数据集。我们可以使用sci-kit学习缩放/归一化方法来实现此目的。
Mathematically, this can be done by subtracting the mean and dividing by the standard deviation for each value of each variable.
从数学上讲,这可以通过减去平均值并除以每个变量每个值的标准差来实现。
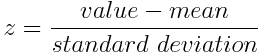
Once the standardization is done, all the variables will be transformed to the same scale.
一旦完成标准化,所有变量将转换为相同的比例。
B:查找归一化数据集的协方差 (B: Find The Covariance Of The Normalized Data Set)
For 2D vectors: Our 2×2 Covariance matrix will look like,
对于2D向量:我们的2×2协方差矩阵如下所示:
Where,
哪里,
Var[X1] = Cov[X1,X1] and Var[X2] = Cov[X2,X2].
Var [X1] = Cov [X1,X1]和Var [X2] = Cov [X2,X2]。
C:找到协方差矩阵的特征向量和特征值: (C: Find the Eigenvectors and EigenValues of the Covariance matrix :)
Next, we calculate eigenvalues and eigenvectors for the covariance matrix. The matrix here is a square matrix A. ƛ is an eigenvalue for a matrix A if we get equation given below:
接下来,我们计算协方差矩阵的特征值和特征向量。 这里的矩阵是一个方阵A.ƛ是一个矩阵A的特征值,如果我们得到方程如下:
det(ƛI— A)= 0, (det( ƛI — A ) = 0,)
Here,
这里,
I is the identity matrix of the same dimension
我是同一个维度的单位矩阵
A which is a required condition for the matrix subtraction
A是矩阵减法的必要条件
det’is the determinant of the matrix.
det'是矩阵的行列式。
For each eigenvalue ƛ, a corresponding eigenvector v, can be found by solving:
对于每个特征值ƛ ,可以通过求解来找到对应的特征向量v :
(ƛI— A)v = 0 (( ƛI — A )v = 0)
D:计算特征向量以形成个人成分空间: (D: Calculating the feature vector to form Personal Component Space:)
We rank the eigenvalues from largest to smallest so that it gives us the components in order of significance. Here at this stage we try to reduce the dimension to find the eigenvectors which will be forming the feature vectors, which is a matrix of vectors, called the eigenvectors.
我们从最大到最小对特征值进行排序,以便按重要性顺序为我们提供分量。 在此阶段,我们在此阶段尝试减小维数以找到将形成特征向量的特征向量,该特征向量是向量的矩阵,称为特征向量。
Feature Vector = (eig1, eig2, eg3,… ), depends upon the mathematical space we are dealing with.
特征向量=(eig1,eig2,eg3,…),取决于我们要处理的数学空间。
E:形成主要成分: (E: Forming Principal Components :)
After we go through previous steps we make use of the feature vector values, transpose it and multiply it with the transpose of the scaled features of the original which we performed at the initial stage of normalization.
在完成前面的步骤之后,我们使用特征向量值,对其进行转置并将其与我们在归一化初始阶段执行的原始缩放比例特征的转置相乘。
We build a new reduced dataset from the K chosen principle components.
我们从K个选定的主成分中构建了一个新的简化数据集。
reducedData= FeatureVectorT x ScaledDataT
reduceData = FeatureVectorT x ScaledDataT
Here, reducedDatais the Matrix consisting of the principal components,
在这里, reduceData是由主要成分组成的矩阵,
FeatureVectoris the matrix we formed using the eigenvectors we chose to keep, and
FeatureVector是我们使用选择保留的特征向量形成的矩阵,并且
ScaledDatais the scaled version of the original dataset. T stands for transpose we perform on the feature and scaled data.
ScaledData是原始数据集的缩放版本。 T代表我们对特征和缩放数据执行的转置。
总结PCA: (Summarizing PCA:)
PCA brings together:
PCA汇集了:
- A measure of how each variable is associated with one another. It uses the Covariance matrix to do so.一种度量每个变量如何相互关联的度量。 它使用协方差矩阵执行此操作。
- The directions in which our data are dispersed. (Eigenvectors.)数据分散的方向。 (特征向量)
- The relative importance of these different directions. (Eigenvalues.)这些不同方向的相对重要性。 (特征值)。
PCA combines our predictors and allows us to drop the eigenvectors that are relatively unimportant
PCA结合了我们的预测变量,并允许我们删除相对不重要的特征向量
PCA的缺点: (The disadvantage of PCA :)
- These components are hard to interpret in prediction这些成分很难在预测中解释
- Sensitive to the certain outliers对某些离群值敏感
- PCA assumes that features are highly correlated, which may or may not be the case on a real-world scenarioPCA假定功能高度相关,在实际情况下可能会或可能不会
使用Python的动手PCA实现: (Hands-On PCA Implementation Using Python :)
We will cover all the explained steps above in our hands-on python lab, where we will understand how to deal with the problem of the curse of dimensionality using PCA and will also see how to implement principal component analysis using python.
我们将在动手操作的python实验中介绍上述所有步骤,在该实验中,我们将了解如何使用PCA处理维度诅咒的问题,还将了解如何使用python实现主成分分析。
See you soon in Part 2 of our PCA series,
即将在我们的PCA系列第2部分中与您见面,
值得深思的事情,在我退出之前: (Food for thought Before I sign-off:)
“ The more you try to make sense of data the more informed & responsible business leader you will become.”
“您越努力理解数据,您将变得越有见识和负责任的业务主管。”
Thanks for being there all along ……
感谢您一直以来的光临……
.
。
…
…
主成分分析 独立成分分析