最近做了一个需求,UI设计是这样: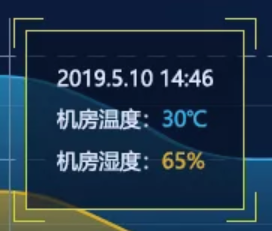
我脑袋里想到两种方式:要么用echarts里面的 ----> tooltip -------> formatter来进行设置;要么写个组件,用鼠标事件mouseover和mouseout来控制组件的显示。
但是,我吧,就想用formatter来实现。。。。
关于tooltip的配置如下:
            tooltip: {
              trigger: 'axis',
              axisPointer: {
                type: 'shadow',
                textStyle: {
                  color: '#ffffff'
                }
              },
              backgroundColor: null,
              // borderColor: '#FCEA00',
              // borderWidth: 1,
              borderRadius: 0,
              padding: [10, 10, 10, 10],
              textStyle: {
                align: 'left',
                fontSize: 14
              },
              formatter: function (v) {
                var str = ''
                v.forEach((item) => {
                  var unit = item.seriesName === '温度' ? '℃' : '%'
                  var str2 = item.marker + type + item.seriesName + ': ' + '<span style="color: ' + item.color + ';font-family:Microsoft YaHei;font-weight:700;">' + item.data[1] + unit + '</span>' + '<br/>'
                  str = str + str2
                })
                var y = new Date(parseInt(v[0].axisValue * 1000)).getFullYear()
                var m = new Date(parseInt(v[0].axisValue * 1000)).getMonth() + 1 > 9 ? new Date(parseInt(v[0].axisValue * 1000)).getMonth() + 1 : '0' + (new Date(parseInt(v[0].axisValue * 1000)).getMonth() + 1)
                var d = new Date(parseInt(v[0].axisValue * 1000)).getDate() > 9 ? new Date(parseInt(v[0].axisValue * 1000)).getDate() : '0' + new Date(parseInt(v[0].axisValue * 1000)).getDate()
                var h = new Date(parseInt(v[0].axisValue * 1000)).getHours() > 9 ? new Date(parseInt(v[0].axisValue * 1000)).getHours() : '0' + new Date(parseInt(v[0].axisValue * 1000)).getHours()
                var mm = new Date(parseInt(v[0].axisValue * 1000)).getMinutes() > 9 ? new Date(parseInt(v[0].axisValue * 1000)).getMinutes() : '0' + new Date(parseInt(v[0].axisValue * 1000)).getMinutes()
                var dStr = y + '-' + m + '-' + d + ' ' + h + ':' + mm
                var inner = '<div style="padding: 25px 20px; border: 1px solid #FCEA00; background-color: rgba(0, 0, 0, 0.7);">' + dStr + '<br/>' + str + '</div>'
                var out = '<div style="background: linear-gradient(to left, #FCEA00, #FCEA00) left top no-repeat, linear-gradient(to bottom, #FCEA00, #FCEA00) left top no-repeat, linear-gradient(to left, #FCEA00, #FCEA00) right top no-repeat, linear-gradient(to bottom, #FCEA00, #FCEA00) right top no-repeat, linear-gradient(to left, #FCEA00, #FCEA00) left bottom no-repeat, linear-gradient(to bottom, #FCEA00, #FCEA00) left bottom no-repeat, linear-gradient(to left, #FCEA00, #FCEA00) right bottom no-repeat, linear-gradient(to left, #FCEA00, #FCEA00) right bottom no-repeat;background-size: 1px 21px, 21px 1px, 1px 21px, 21px 1px;padding: 10px;">' + inner + '</div>'
                return out
              }
            },
- 首先,将tooltip的backgroundColor设为null ,不设border,假装没有任何的背景和框框
- 里面的数据先找到合适的排列,再加个div 设个border
- 最后外面再加个div 写四个角的border
结果: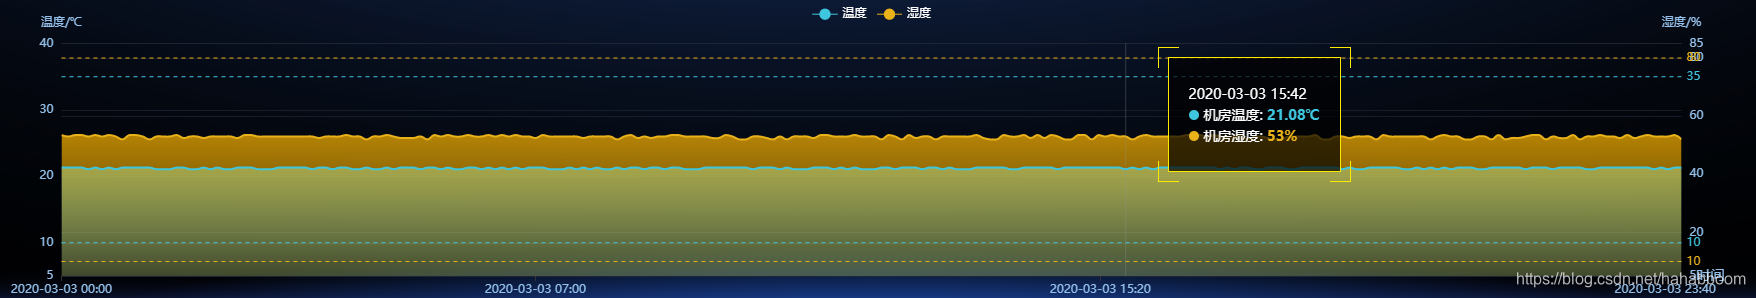
版权声明:本文为hahabboom原创文章,遵循CC 4.0 BY-SA版权协议,转载请附上原文出处链接和本声明。