绘制简单散点图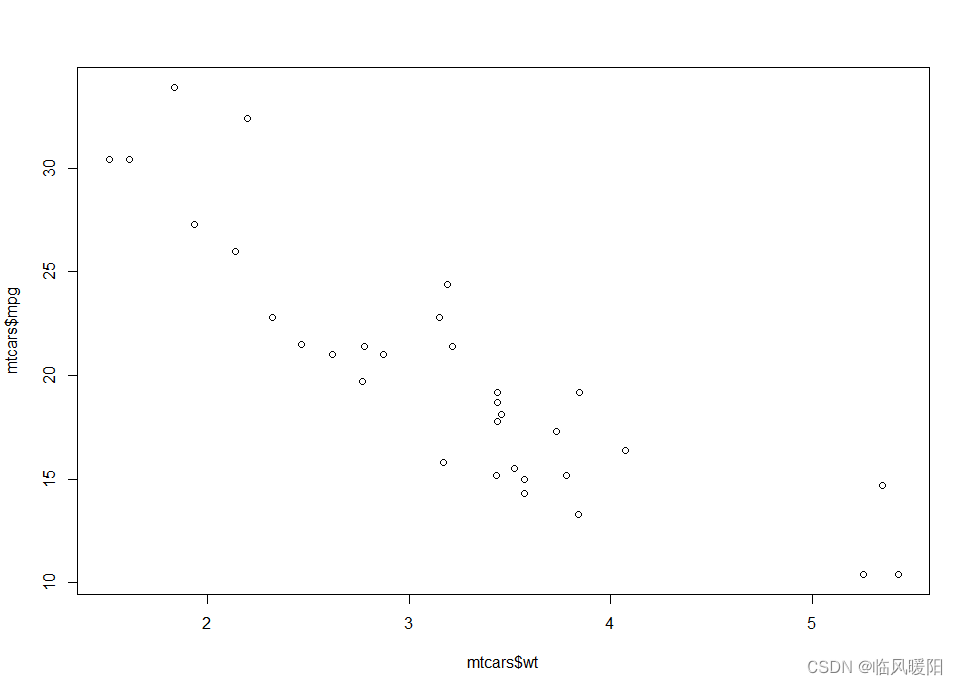
用ggplot绘制散点图
library(ggplot2)
qplot(mtcars$wt, mtcars$mpg)
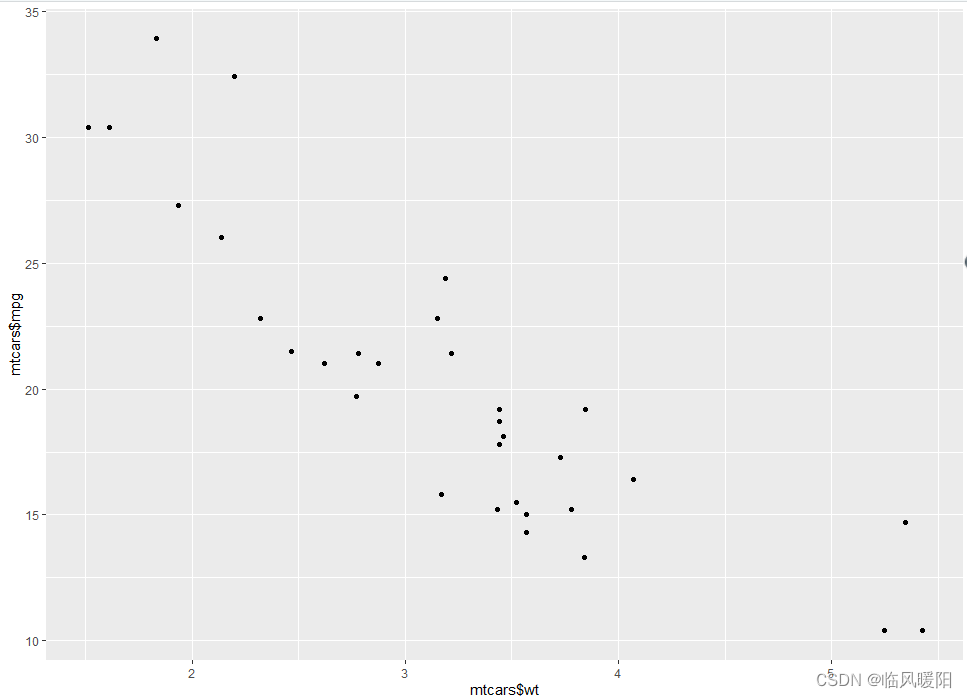
带有标注的散点图
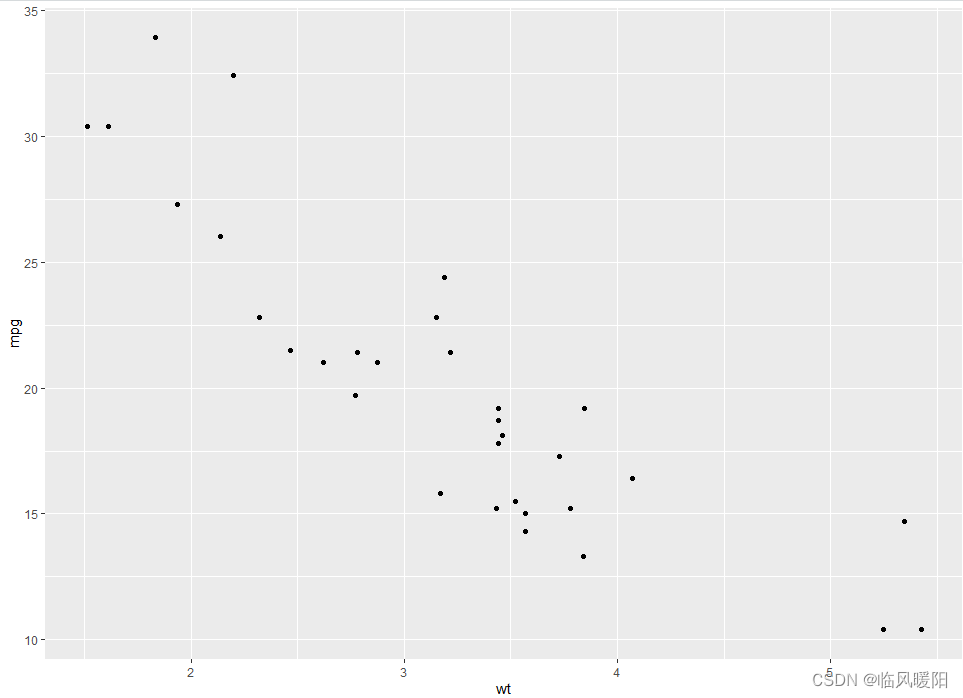
qplot(wt, mpg, data=mtcars)
ggplot(mtcars, aes(x=wt, y=mpg)) + geom_point()
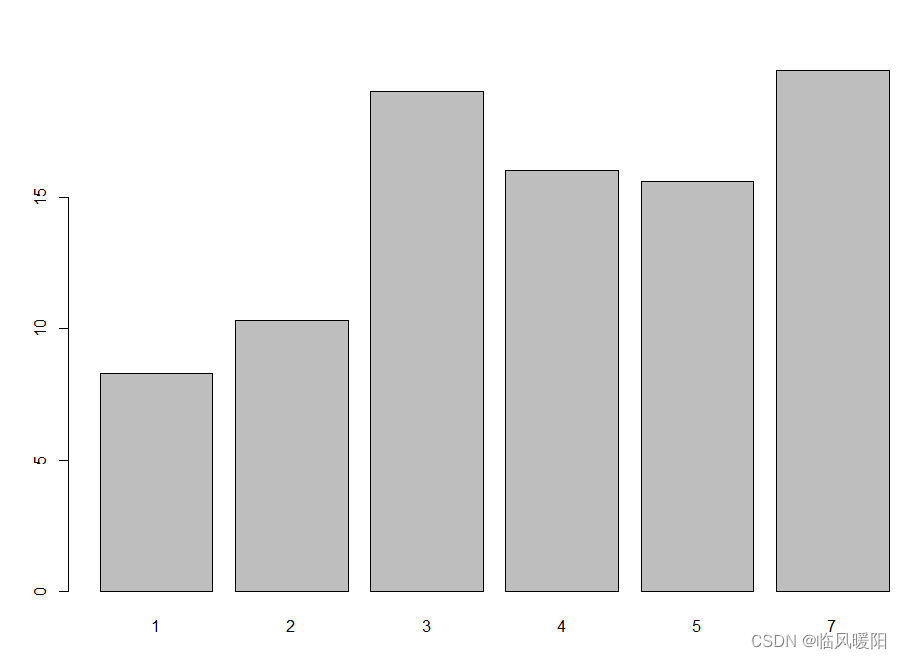
绘制竖桩图
barplot(BOD$demand, names.arg=BOD$Time)
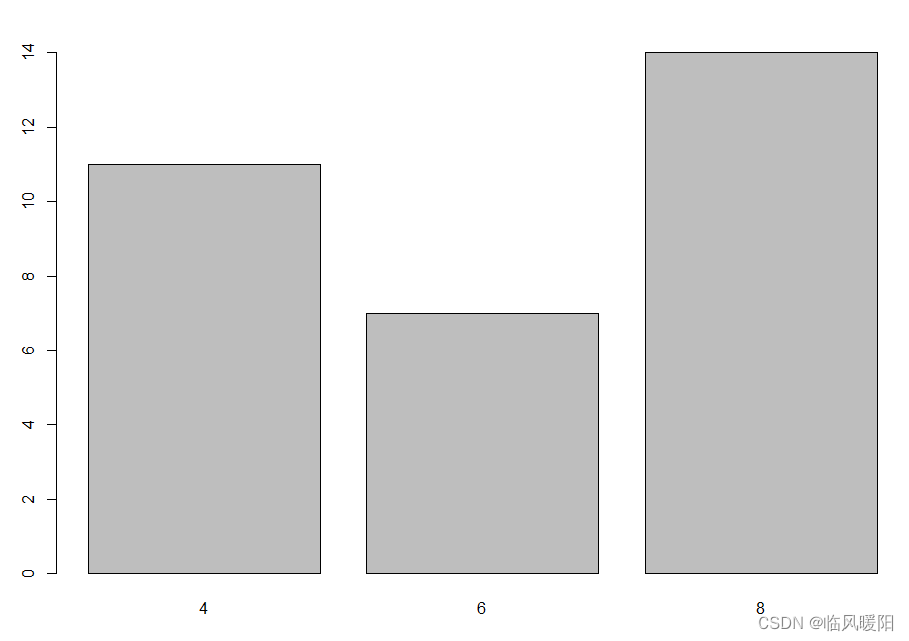
table(mtcars$cyl)
barplot(table(mtcars$cyl))
qplot(Time, demand, data=BOD, geom="bar", stat="identity")
# This is equivalent to:
ggplot(BOD, aes(x=Time, y=demand)) + geom_bar(stat="identity")
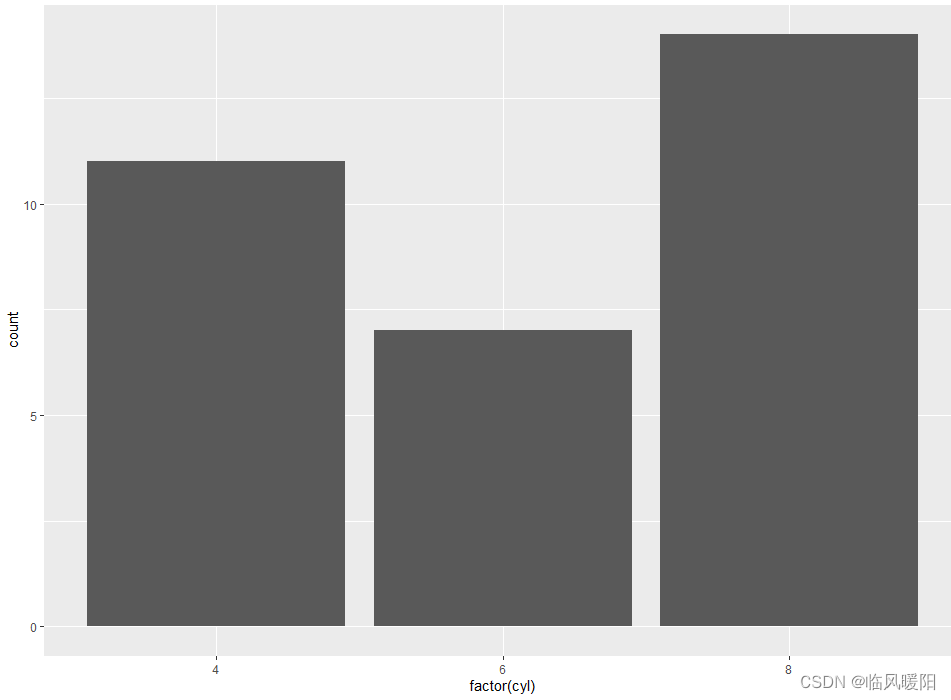
# Bar graph of counts
qplot(factor(cyl), data=mtcars)
# This is equivalent to:
ggplot(mtcars, aes(x=factor(cyl))) + geom_bar()
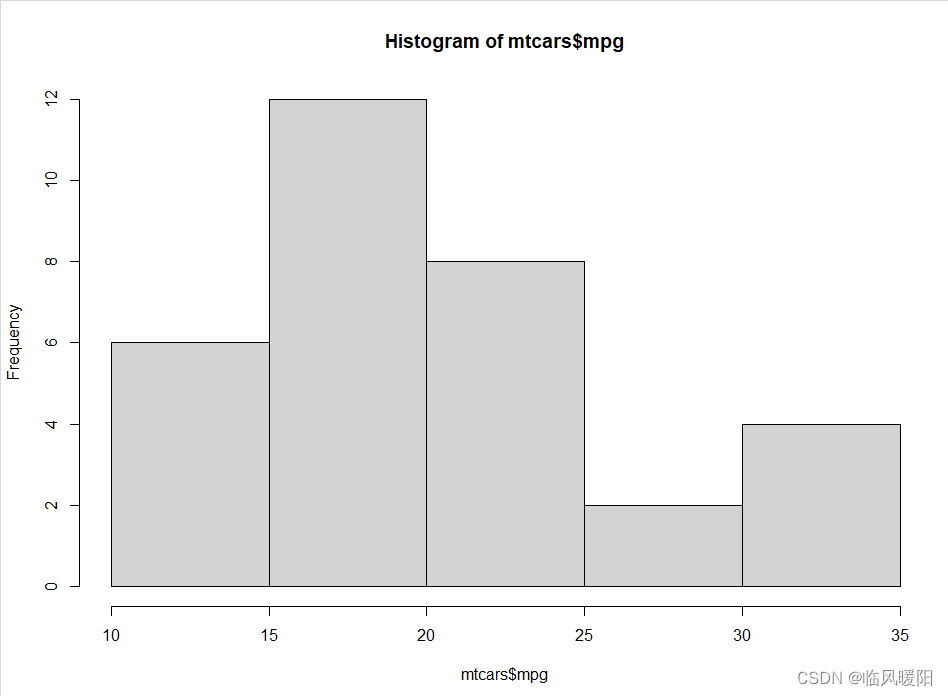
hist(mtcars$mpg)
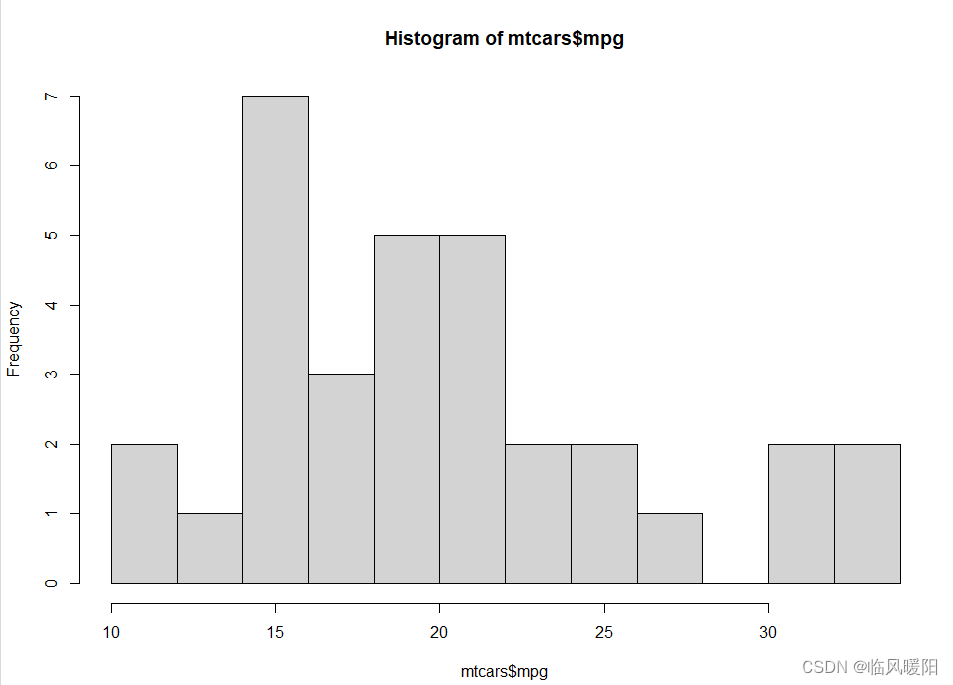
hist(mtcars$mpg, breaks=10)
R Graphics Cookbook----O’REILLY—[美]Winston Chang
开发环境:RStudio 4.2.0
版权声明:本文为m0_38127487原创文章,遵循CC 4.0 BY-SA版权协议,转载请附上原文出处链接和本声明。