自定义监控mysql主从状态
- 环境说明
| ip | 服务器类型 |
|---|---|
| 192.168.218.132 | zabbix服务器 |
| 192.168.218.133 | mysql-slave端 |
| 192.168.218.131 | mysql-master端 |
需搭建好MySQL主从环境,如何搭建–>MySQL主从配置
- 编写脚本
[root@localhost scripts]# mkdir /scripts
[root@localhost scripts]# touch check_mysql_slave_status.sh
[root@localhost scripts]# chmod +x check_mysql_slave_status.sh
[root@localhost scripts]# vim check_mysql_slave_status.sh
#!/bin/bash

count=$(mysql -uroot -pwa123 -e 'show slave status\G' 2>/dev/null|grep -E 'Slave_IO_Running|Slave_SQL_Running' |awk '{print $2}'|grep -c Yes)
if [ $count -eq 2 ];then
    echo '0'      //0代表主从正常
else
    echo '1'      //1代表主从异常
fi
- 修改配置文件添加脚本路径
[root@localhost ~]# vim /usr/local/etc/zabbix_agentd.conf
UnsafeUserParameters=0                  //把值修改为1
UnsafeUserParameters=1                  //修改后
UserParameter=check_slave,/scripts/check_mysql_slave_status.sh
- 重启服务
[root@localhost ~]# pkill zabbix
[root@localhost ~]# zabbix_agentd
[root@localhost ~]# ss -antl
State      Recv-Q      Send-Q           Local Address:Port            Peer Address:Port     Process
LISTEN     0           128                    0.0.0.0:10050                0.0.0.0:*
LISTEN     0           128                    0.0.0.0:22                   0.0.0.0:*
LISTEN     0           80                           *:3306                       *:*
LISTEN     0           128                       [::]:22                      [::]:*
- 测试key(服务端)
[root@localhost ~]# zabbix_get -s 192.168.218.133 -k check_slave
0
//返回值为0,key正常
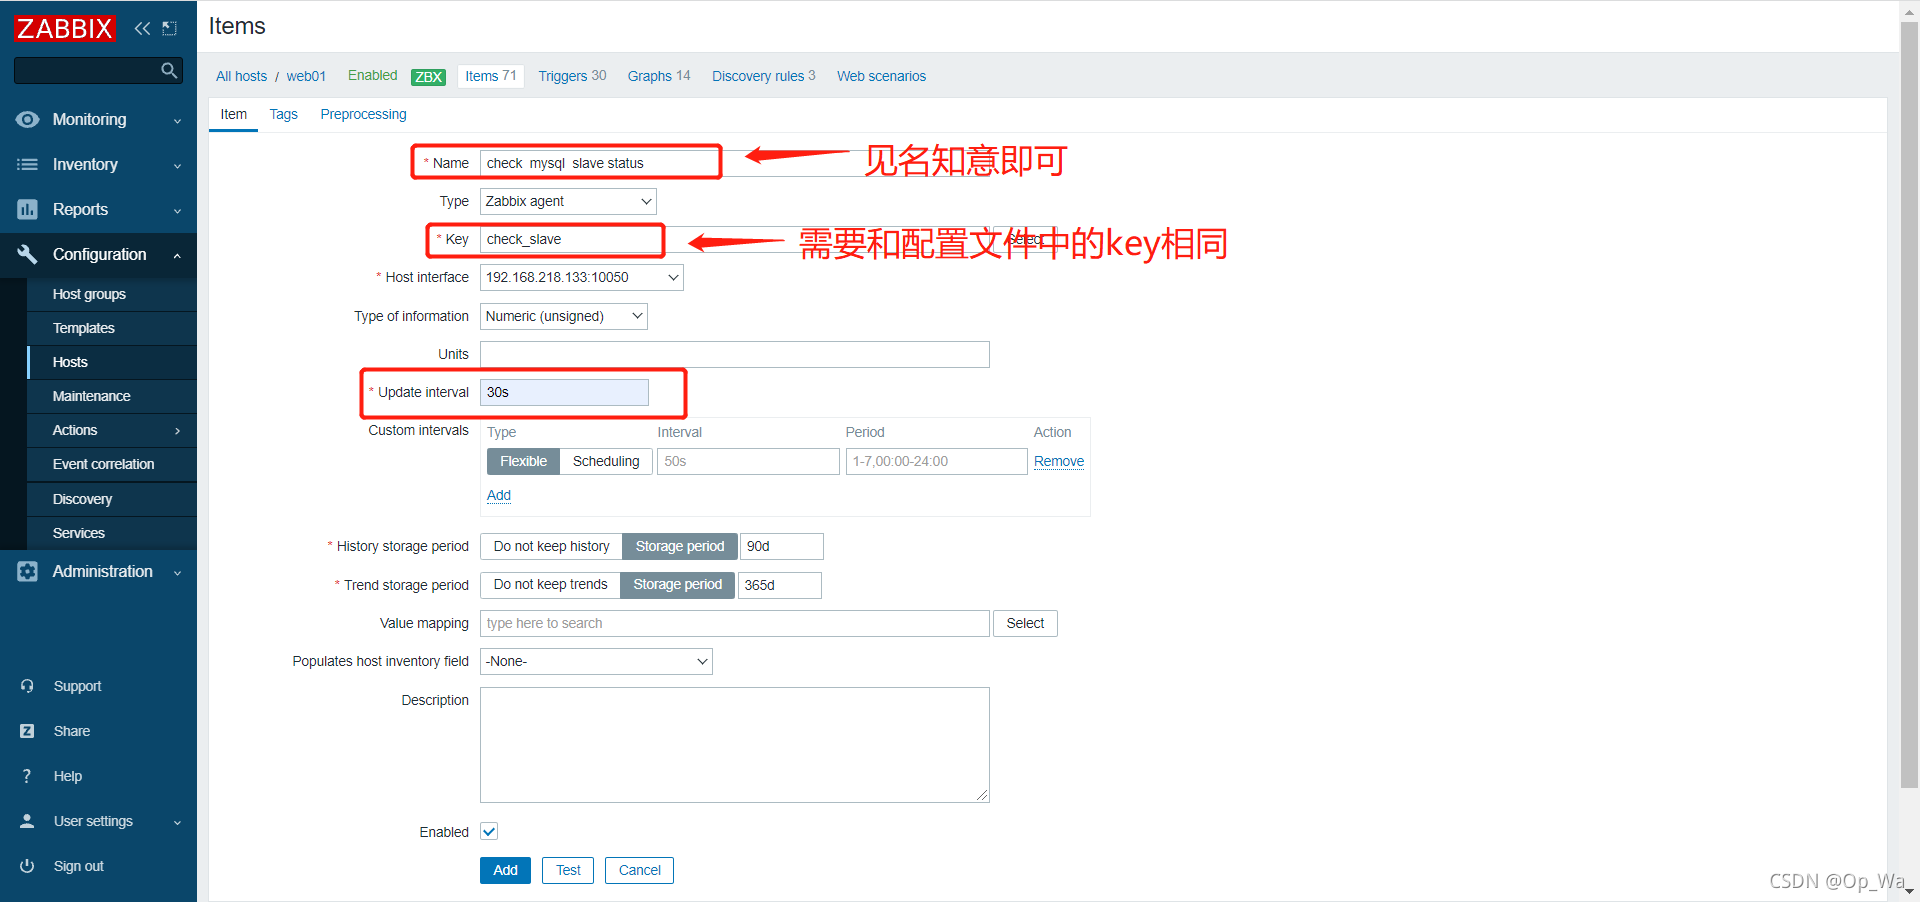
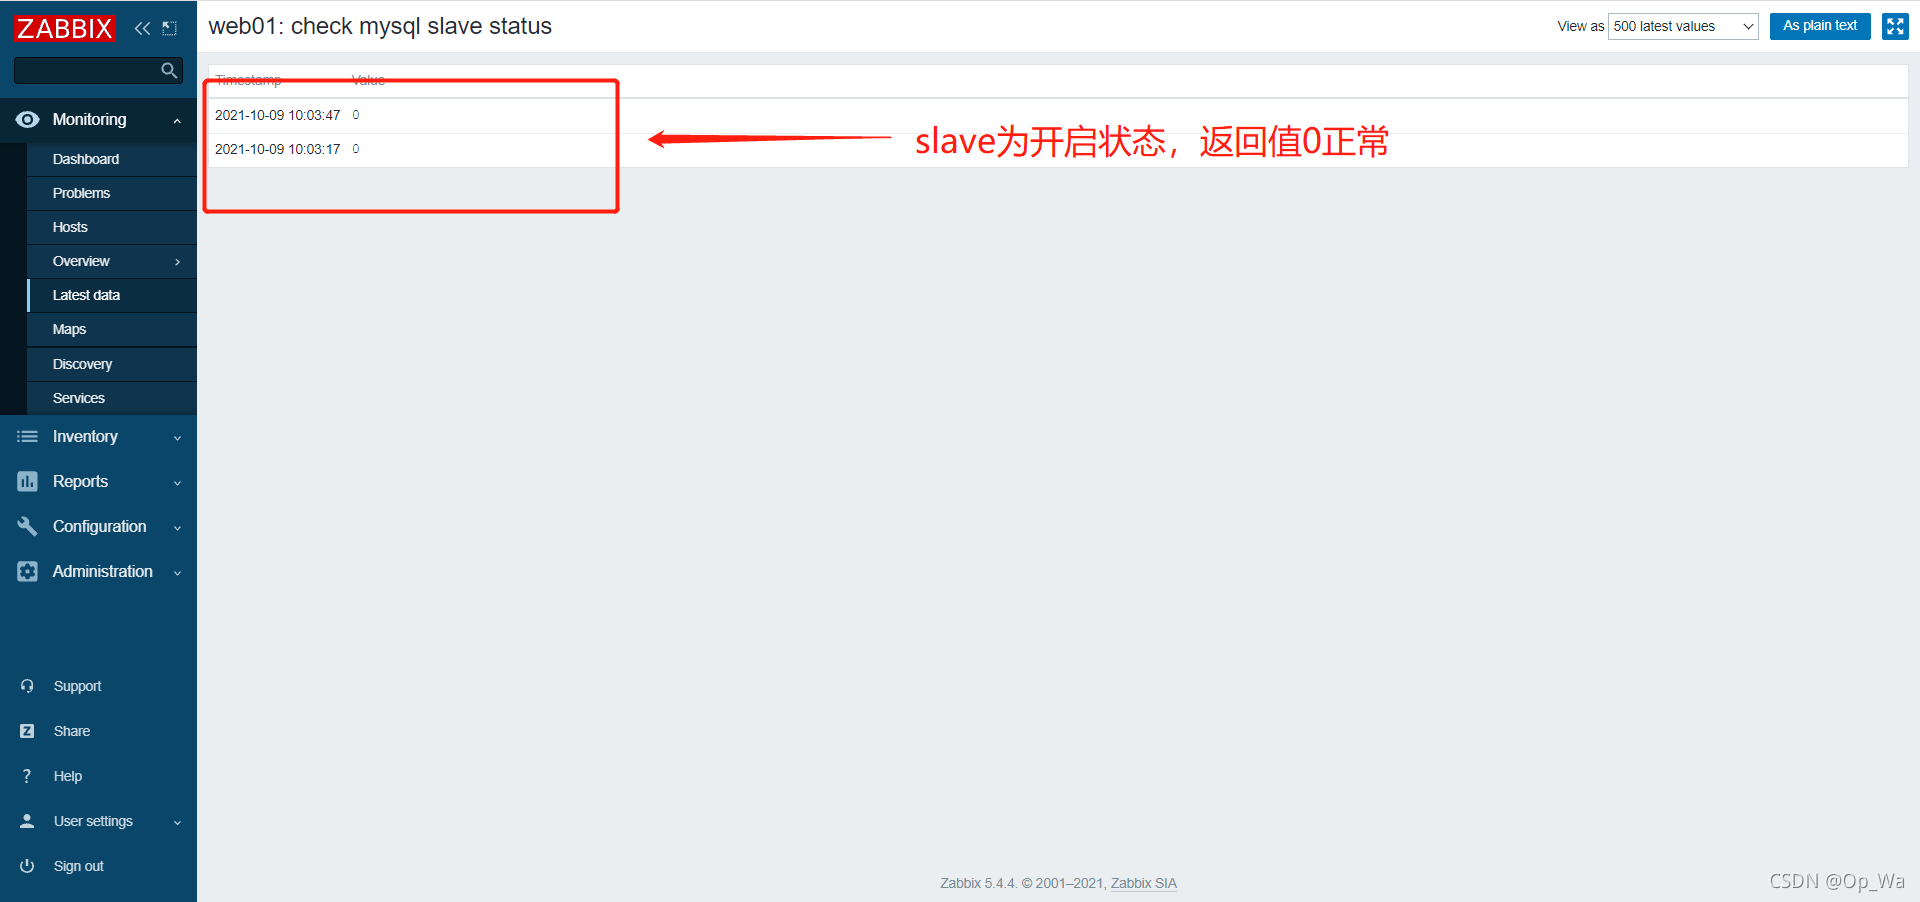
- web界面配置监控项
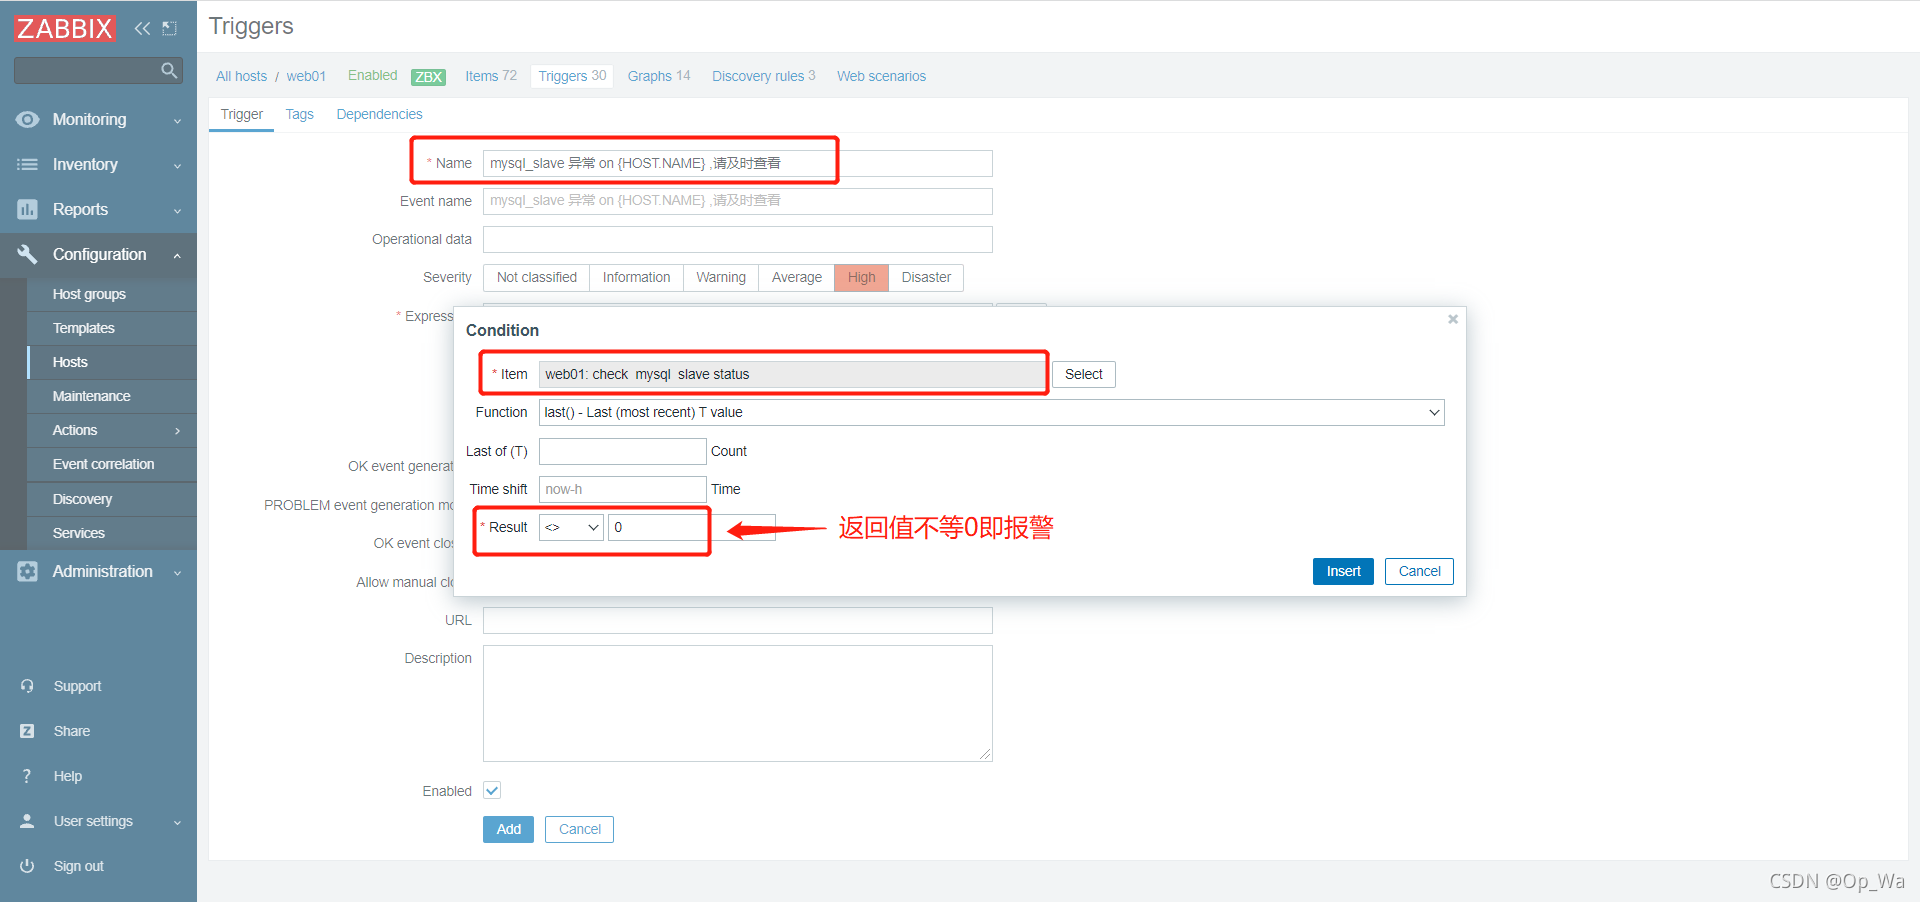
- web界面配置触发器
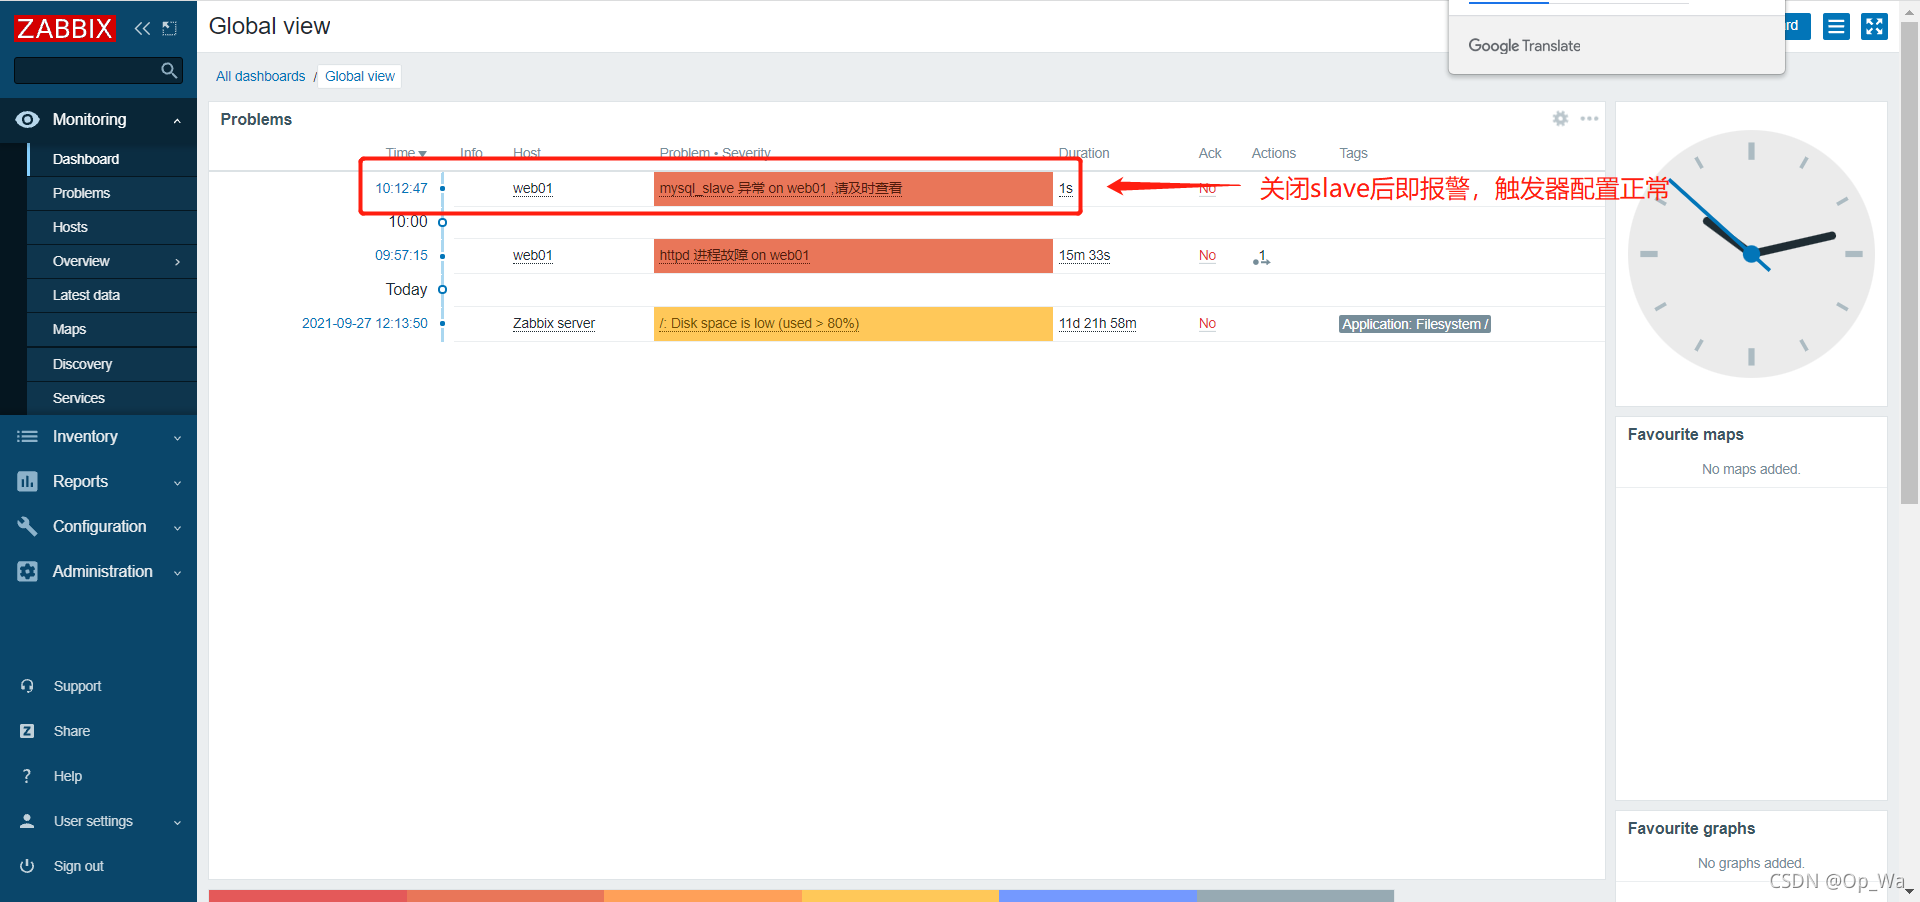
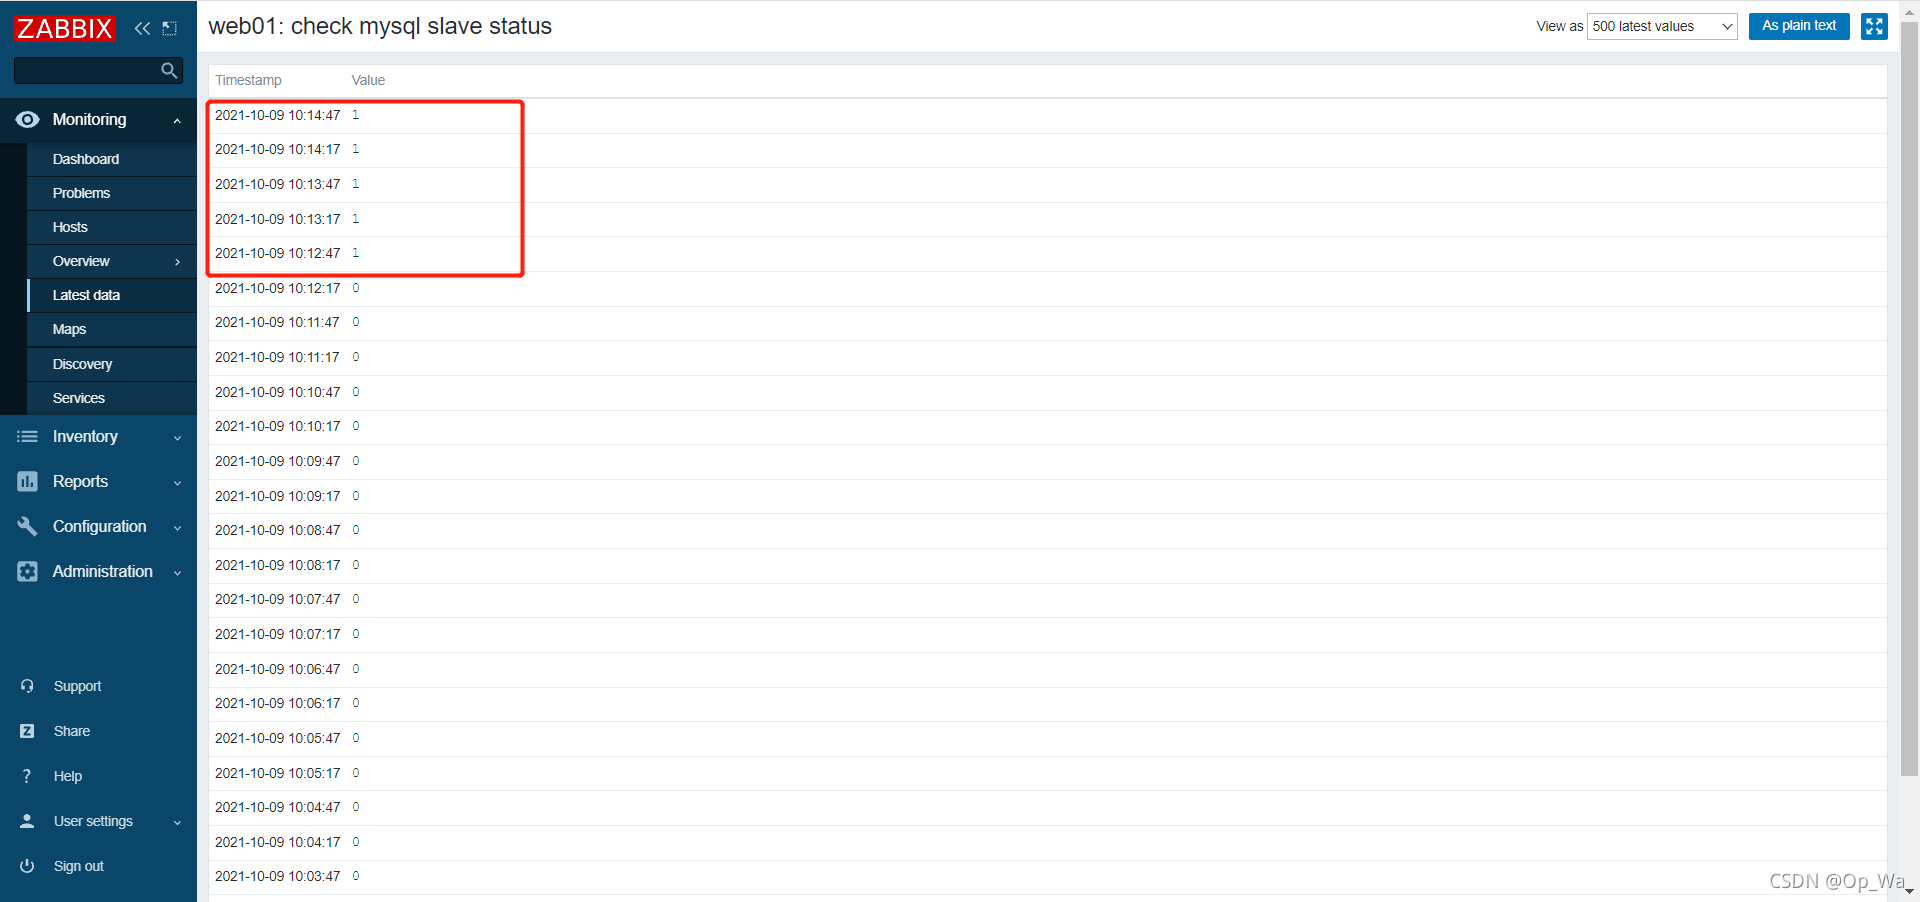
- 测试触发器
关掉mysql_slave,测试是否报警
mysql> stop slave;
Query OK, 0 rows affected (0.00 sec)
自定义mysql监控配置完成
版权声明:本文为Op_Wa原创文章,遵循CC 4.0 BY-SA版权协议,转载请附上原文出处链接和本声明。