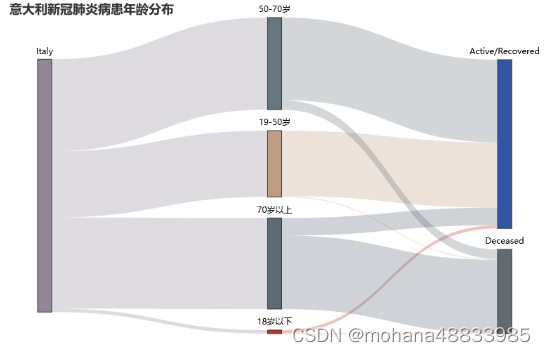
links = [{'source': 'Italy', 'target': '18岁以下', 'value': '1677'},
{'source': '18岁以下', 'target': 'Deceased', 'value': '167'},
{'source': '18岁以下', 'target': 'Active/Recovered', 'value': '1510'},
{'source': 'Italy', 'target': '19-50岁', 'value': '31394'},
{'source': '19-50岁', 'target': 'Deceased', 'value': '408'},
{'source': '19-50岁', 'target': 'Active/Recovered', 'value': '30986'},
{'source': 'Italy', 'target': '50-70岁', 'value': '43617'},
{'source': '50-70岁', 'target': 'Deceased', 'value': '4492'},
{'source': '50-70岁', 'target': 'Active/Recovered', 'value': '39125'},
{'source': 'Italy', 'target': '70岁以上', 'value': '43139'},
{'source': '70岁以上', 'target': 'Deceased', 'value': '34813'},
{'source': '70岁以上', 'target': 'Active/Recovered', 'value': '8326'}]
nodes = [{'name': 'Italy'}, {'name': '18岁以下'}, {'name': '19-50岁'},
{'name': '50-70岁'}, {'name': '70岁以上'}, {'name': 'Deceased'},
{'name': 'Active/Recovered'}]
from pyecharts.charts import Sankey
from pyecharts import options as opts
pic = (
Sankey().add('',
nodes,
links,
linestyle_opt=opts.LineStyleOpts(opacity = 0.3, curve = 0.5, color = 'source'),
label_opts=opts.LabelOpts(position = 'top'),
node_gap = 30,
)
.set_global_opts(title_opts=opts.TitleOpts(title = '意大利新冠肺炎病患年龄分布'))
)
pic.render_notebook()