一、爬取数据
使用scrapy,不多说,上码
1、spider
import scrapy


from lianjia.items import anjukeItem


class AnjukeSpider(scrapy.Spider):
    name = 'anjuke'
    allowed_domains = ['anjuke.com', 'shenzhen.anjuke.com']
    start_urls = ['https://shenzhen.anjuke.com/sale/?pi=baidu-cpc-sz-cty1&kwid=210821712325&bd_vid=6500656477618314429']

    def parse(self, response):
        ls = response.xpath('//div[@class="property"]')
        item = anjukeItem()
        for l in ls:
            home_title = l.xpath('.//h3/@title').extract_first()
            home_size = l.xpath('.//p[@class="property-content-info-text"][1]/text()').extract_first().strip()
            home_addres = l.xpath('string(.//div[@class="property-content-info property-content-info-comm"])').extract_first()
            home_single_price = l.xpath('.//p[@class="property-price-average"]/text()').extract_first()
            home_commpy = l.xpath('.//span[@class="property-extra-text"][3]/text()').extract_first()
            home_orientations = l.xpath('.//p[@class="property-content-info-text"][2]/text()').extract_first().strip()
            home_height = l.xpath('.//p[@class="property-content-info-text"][3]/text()').extract_first().strip()
            home_year = l.xpath('.//p[@class="property-content-info-text"][4]/text()').extract_first().strip()
            home_layout = l.xpath('string(.//p[@class="property-content-info-text property-content-info-attribute"])').extract_first().strip()
            item['home_title'] = home_title
            item['home_size'] = home_size
            item['home_addres'] = home_addres
            item['home_single_price'] = home_single_price
            item['home_commpy'] = home_commpy
            item['home_orientations'] = home_orientations
            item['home_height'] = home_height
            item['home_year'] = home_year
            item['home_layout'] = home_layout
            yield item
        for i in range(2, 50):
            next_pag_url = f'https://shenzhen.anjuke.com/sale/p{i}/?'
            yield scrapy.Request(url=next_pag_url, callback=self.parse)
2、item
# Define here the models for your scraped items
#
# See documentation in:
# https://docs.scrapy.org/en/latest/topics/items.html

import scrapy


class anjukeItem(scrapy.Item):
    # define the fields for your item here like:
    home_title = scrapy.Field()
    home_size = scrapy.Field()
    home_addres = scrapy.Field()
    home_single_price = scrapy.Field()
    home_commpy = scrapy.Field()
    home_orientations = scrapy.Field()
    home_height = scrapy.Field()
    home_year = scrapy.Field()
    home_layout = scrapy.Field()
3、pipelines
class anjuketxtPipeline:
    # def process_item(self, item, spider):
    #     return item
    def open_spider(self, spider):
        self.fp = open('./anjuke.txt', mode='w+', encoding='utf-8')
        self.fp.write('home_title, home_size, home_addres, home_single_price, home_commpy, home_orientations, home_height, home_year, home_layout\n')

    def process_item(self, item, spider):
        # 写入文件
        try:
            line = ';'.join(list(item.values())) + '\n'
            self.fp.write(line)
            return item
        except:
            pass

    def close_spider(self, spider):
        # 关闭文件
        self.fp.close()
二、使用jupyter分析
import re
import os
import jieba
import wordcloud
import pandas as pd
import numpy as np
from PIL import Image
import seaborn as sns
from docx import Document
from docx.shared import Inches
import matplotlib.pyplot as plt
from pandas import DataFrame,Series
sns.set_style('darkgrid')
plt.rcParams['font.sans-serif'] = ['SimHei']
plt.rcParams['axes.unicode_minus'] = False
df_home = pd.read_table('./anjuke.txt', sep=';')
df_home[df_home.isnull().any(axis=1) == True]
df_home['loupan_name'] = df_home['home_addres'].str.split(' ', expand=True)[0]
df_home['home_addres']= df_home['home_addres'].str.split(' ', expand=True)[1]
df_home['home_size'] = df_home['home_size'].map(lambda s : re.findall(f'(\d+).*', str(s))[0]).astype('float32')
df_home['home_single_price'] = df_home['home_single_price'].map(lambda s : re.findall(f'(\d+).*', str(s))[0]).astype('float32')
df_home['home_year'] = df_home['home_year'].map(lambda s : re.findall(f'(\d+).*', str(s))[0]).astype('int64')
df_home['sum_price'] = df_home['home_size'] * df_home['home_single_price']
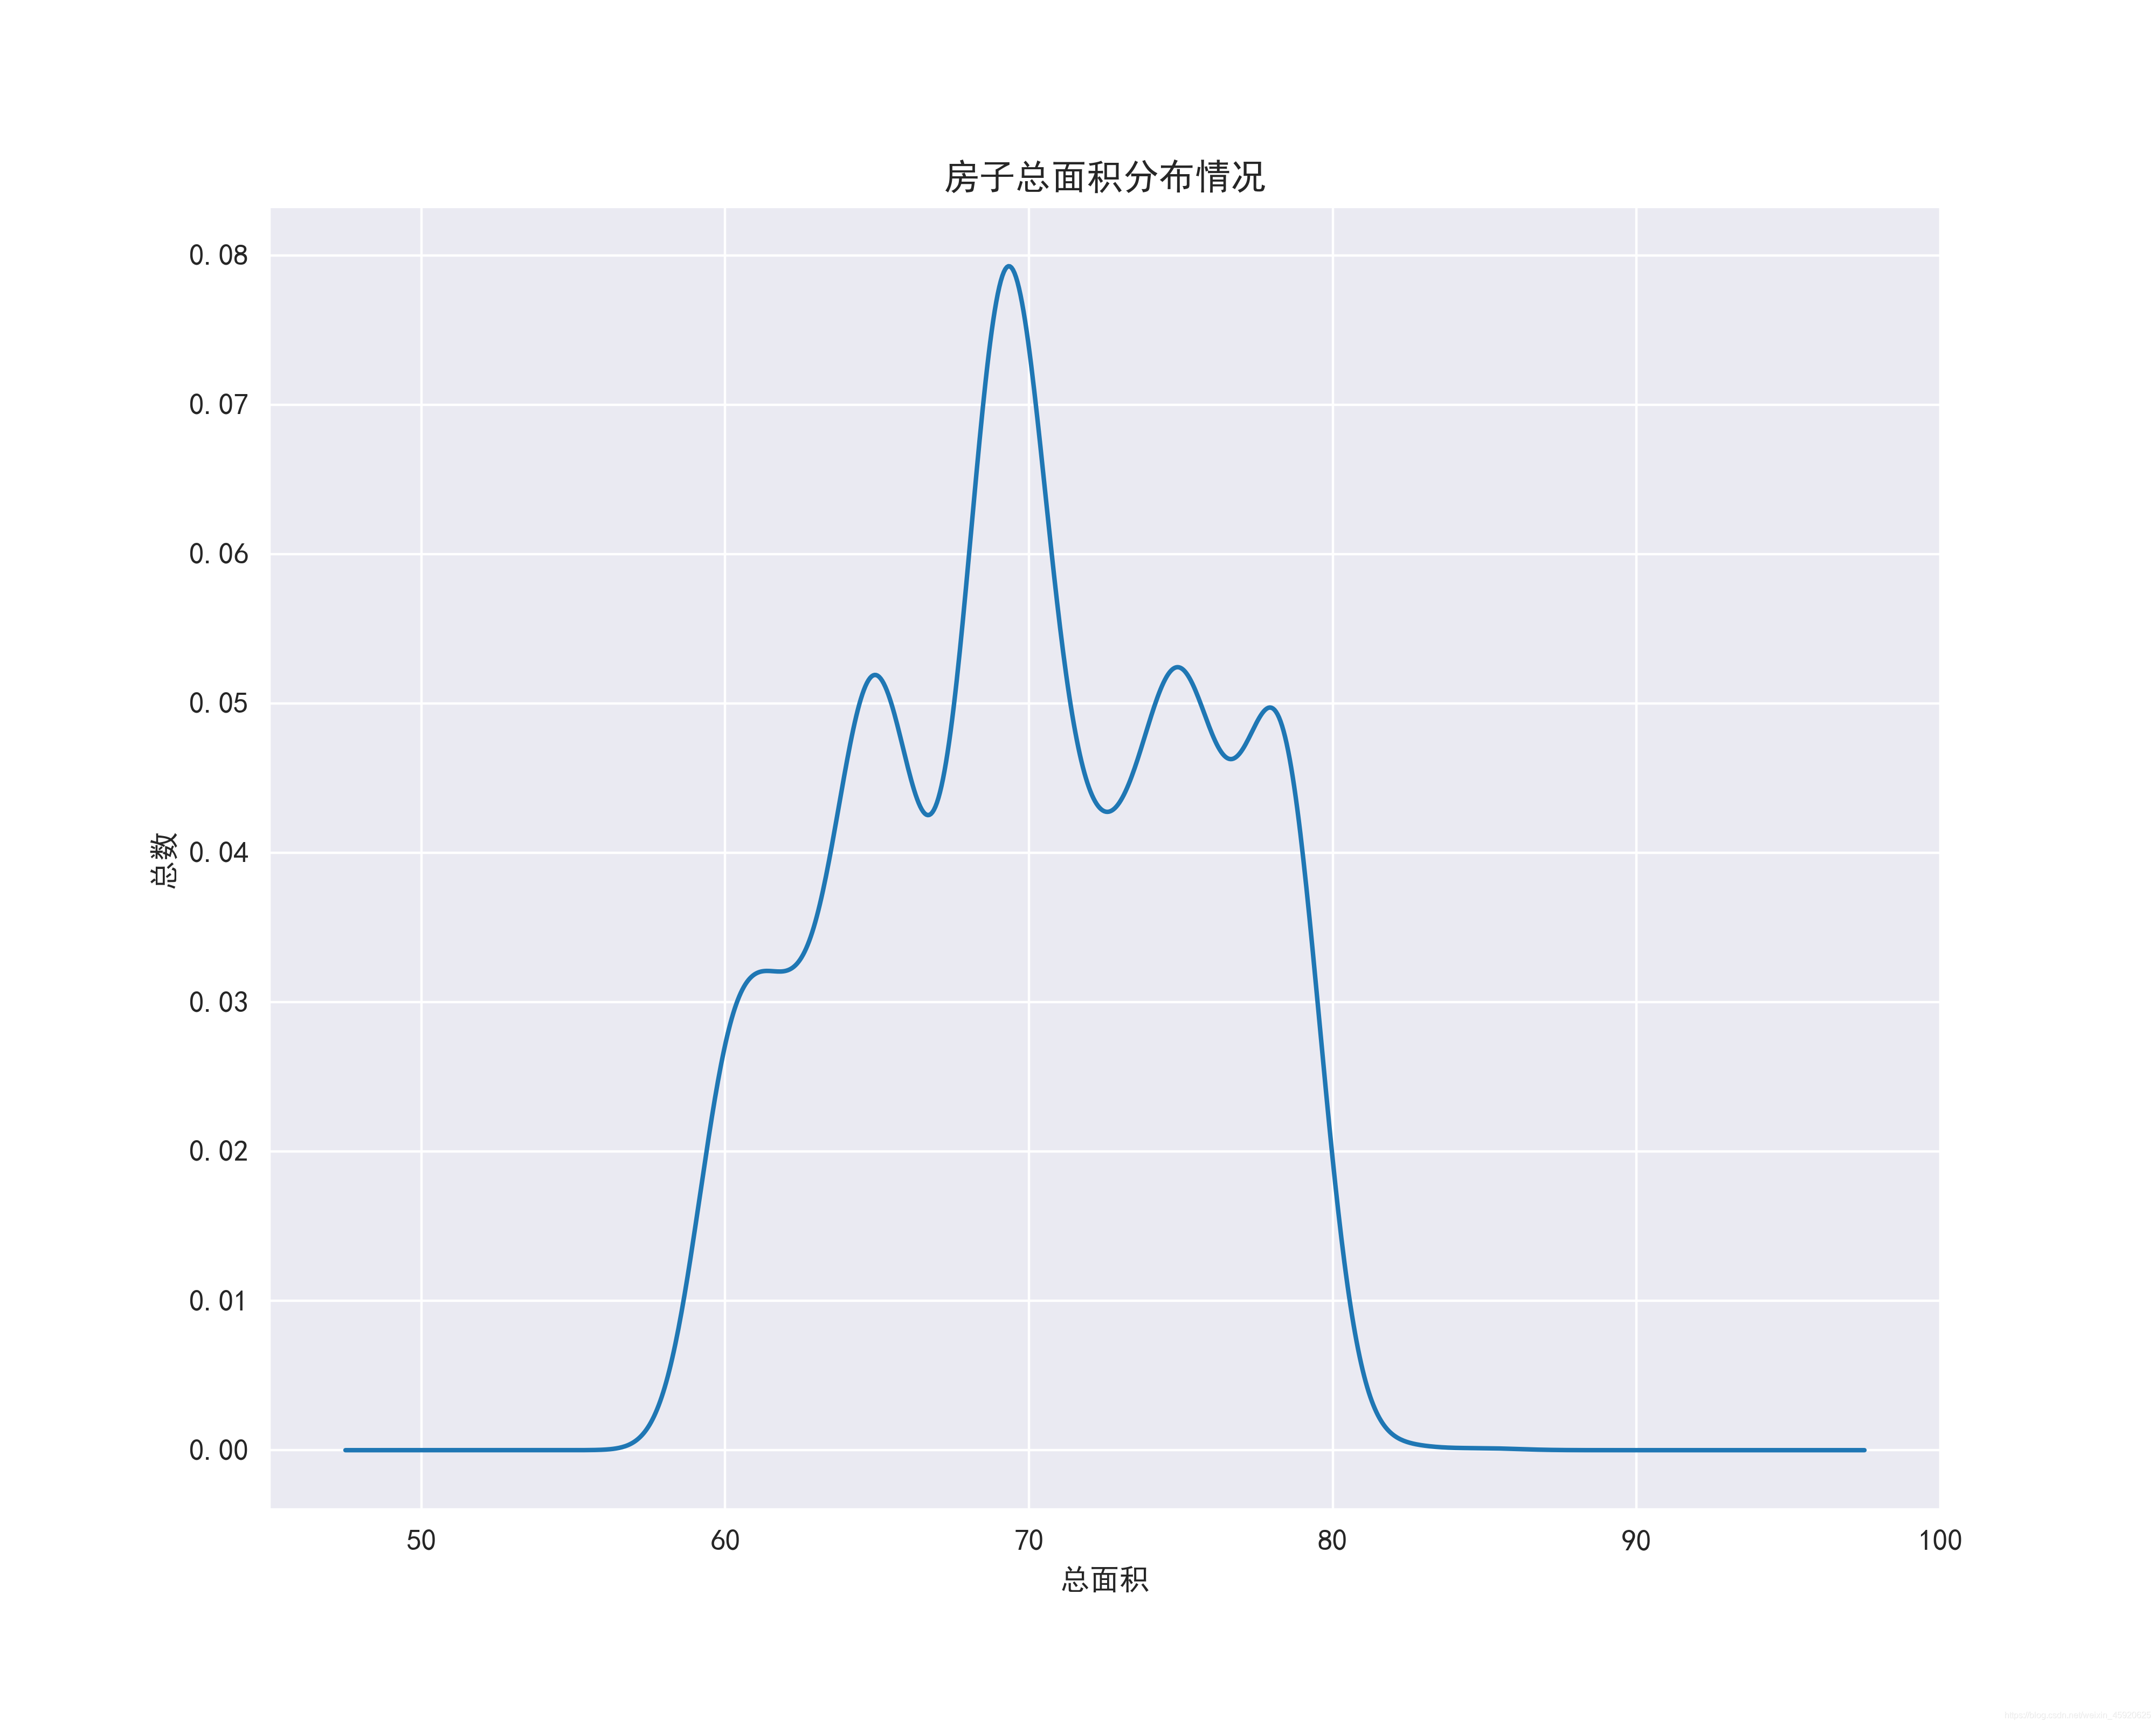
plt.figure(figsize=(10, 8), dpi=100)
ax = df_home.home_size.plot(kind='kde')
ax.set_xlabel('总面积')
ax.set_ylabel('总数')
ax.set_title('房子总面积分布情况')
boxplot_fig = ax.get_figure()
boxplot_fig.savefig('房子总面积分布情况.png', dpi=400)
plt.figure(figsize=(18, 10), dpi=100)
ax = sns.boxplot(x='home_year', y='sum_price', data=df_home)
ax.set_xlabel('年份')
ax.set_ylabel('总价')
ax.set_title('各年份价格区间分布')
boxplot_fig = ax.get_figure()
boxplot_fig.savefig('各年份价格区间分布.png', dpi=400)

plt.figure(figsize=(10, 8), dpi=100)
ax = sns.barplot(x='loupan_name', y='home_single_price', data=df_home.sort_values(by='home_single_price', ascending=False).iloc[:10, :], hue='home_year')
ax.set_xlabel('楼盘名称')
ax.set_ylabel('单价')
ax.set_title('单价排名前十的楼盘')
boxplot_fig = ax.get_figure()
boxplot_fig.savefig('单价排名前十的楼盘.png', dpi=400)

plt.figure(figsize=(10, 8), dpi=100)
ax = sns.barplot(x='loupan_name', y='home_single_price', data=df_home.sort_values(by='home_single_price', ascending=False).iloc[:10, :], hue='home_height')
ax.set_xlabel('楼盘名称')
ax.set_ylabel('单价')
ax.set_title('单价排名前十的楼盘的层高')
boxplot_fig = ax.get_figure()
boxplot_fig.savefig('单价排名前十的楼盘的层高.png', dpi=400)

plt.figure(figsize=(10, 8), dpi=100)
ax = sns.barplot(x='loupan_name', y='home_single_price', data=df_home.sort_values(by='home_single_price', ascending=False).iloc[:10, :], hue='home_size')
ax.set_xlabel('楼盘名称')
ax.set_ylabel('单价')
ax.set_title('单价排名前十的楼盘大小')
boxplot_fig = ax.get_figure()
boxplot_fig.savefig('单价排名前十的楼盘大小.png', dpi=400)

plt.figure(figsize=(10, 8), dpi=100)
ax = sns.barplot(x='loupan_name', y='home_single_price', data=df_home.sort_values(by='home_single_price', ascending=False).iloc[:10, :], hue='home_layout')
ax.set_xlabel('楼盘名称')
ax.set_ylabel('单价')
ax.set_title('单价排名前十的楼盘布局')
boxplot_fig = ax.get_figure()
boxplot_fig.savefig('单价排名前十的楼盘布局.png', dpi=400)

plt.figure(figsize=(10, 8), dpi=100)
ax = sns.barplot(x='loupan_name', y='home_single_price', data=df_home.sort_values(by='home_single_price', ascending=False).iloc[:10, :], hue='home_commpy')
ax.set_xlabel('楼盘名称')
ax.set_ylabel('单价')
ax.set_title('单价排名前十的楼盘公司')
boxplot_fig = ax.get_figure()
boxplot_fig.savefig('单价排名前十的楼盘公司.png', dpi=400)

plt.figure(figsize=(10, 8), dpi=100)
ax = sns.barplot(x='loupan_name', y='home_single_price', data=df_home.sort_values(by='home_single_price', ascending=False).iloc[:10, :], hue='home_addres')
ax.set_xlabel('楼盘名称')
ax.set_ylabel('单价')
ax.set_title('单价排名前十的楼盘地理位置')
boxplot_fig = ax.get_figure()
boxplot_fig.savefig('单价排名前十的楼盘地理位置.png', dpi=400)

plt.figure(figsize=(10, 8), dpi=100)
ax = sns.barplot(x='loupan_name', y='home_single_price', data=df_home.sort_values(by='home_single_price', ascending=False).iloc[:10, :], hue='home_orientations')
ax.set_xlabel('楼盘名称')
ax.set_ylabel('单价')
ax.set_title('单价排名前十的楼盘朝向')
boxplot_fig = ax.get_figure()
boxplot_fig.savefig('单价排名前十的楼盘朝向.png', dpi=400)

plt.figure(figsize=(10, 8), dpi=100)
ax = df_home.groupby(by='home_layout')['loupan_name'].count().plot(kind='bar')
ax.set_xlabel('布局')
ax.set_ylabel('总数')
ax.set_title('房子布局最多的类型')
boxplot_fig = ax.get_figure()
boxplot_fig.savefig('房子布局最多的类型.png', dpi=400)

ax = sns.jointplot(x="home_size", y="home_single_price", data=df_home, kind="reg", truncate=False,color="m", height=14)
ax.fig.savefig('房子大小与价格的关系.png')

plt.figure(figsize=(18, 8), dpi=100)
ax = sns.pointplot(x='home_year', y='home_single_price', data=df_home, color='g')
ax.set_xlabel('年份')
ax.set_ylabel('单价')
ax.set_title('房子年份和价格的关系')
boxplot_fig = ax.get_figure()
boxplot_fig.savefig('房子年份和价格的关系.png', dpi=400)

plt.figure(figsize=(10, 8), dpi=100)
ax = sns.pointplot(x='home_year', y='home_single_price', data=df_home.query('home_year>=2010').copy(), color='g')
ax.set_xlabel('年份')
ax.set_ylabel('单价')
ax.set_title('2010年之后房子年份和价格的关系')
boxplot_fig = ax.get_figure()
boxplot_fig.savefig('2010年之后房子年份和价格的关系.png', dpi=400)

import imageio

# 将特征转换为列表
ls = df_home['home_title'].to_list()
# 替换非中英文的字符
feature_points = [re.sub(r'[^a-zA-Z\u4E00-\u9FA5]+',' ',str(feature)) for feature in ls]
# 读取停用词
stop_world = list(pd.read_csv('./百度停用词表.txt', engine='python', encoding='utf-8', names=['stopwords'])['stopwords'])
feature_points2 = []
for feature in feature_points:  # 遍历每一条评论
    words = jieba.lcut(feature) # 精确模式,没有冗余.对每一条评论进行jieba分词
    ind1 = np.array([len(word) > 1 for word in words])  # 判断每个分词的长度是否大于1
    ser1 = pd.Series(words)
    ser2 = ser1[ind1] # 筛选分词长度大于1的分词留下
    ind2 = ~ser2.isin(stop_world)  # 注意取反负号
    ser3 = ser2[ind2].unique()  # 筛选出不在停用词表的分词留下,并去重
    if len(ser3) > 0:
        feature_points2.append(list(ser3))
# 将所有分词存储到一个列表中
wordlist = [word for feature in feature_points2 for word in feature]
# 将列表中所有的分词拼接成一个字符串
feature_str =  ' '.join(wordlist)
# 标题分析
font_path = r'./simhei.ttf'
shoes_box_jpg = imageio.imread('./home.jpg')
wc=wordcloud.WordCloud(
    background_color='black',
    mask=shoes_box_jpg,
    font_path = font_path,
    min_font_size=5,
    max_font_size=50,
    width=260,
    height=260,
)
wc.generate(feature_str)
plt.figure(figsize=(10, 8), dpi=100)
plt.imshow(wc)
plt.axis('off')
plt.savefig('标题提取关键词')

def convert(s):
    if re.findall(f'.*(地铁).*', str(s)) != []:
        sr = re.findall(f'.*(地铁).*', str(s))[0]
        return sr
    elif re.findall(f'.*(阳台).*', str(s)) != []:
        sr_one = re.findall(f'.*(阳台).*', str(s))[0]
        return sr_one
    elif re.findall(f'.*(燃气).*', str(s)) != []:
        sr_three = re.findall(f'.*(燃气).*', str(s))[0]
        return sr_three
    elif re.findall(f'.*(精装修).*', str(s)) != []:
        sr_two = re.findall(f'.*(精装修).*', str(s))[0]
        return sr_two
df_home['home_bytrain'] = df_home['home_title'].map(convert)
plt.figure(figsize=(10, 8), dpi=100)
ax = sns.pointplot(x='home_year', y='home_single_price', data=df_home.query('home_year>=2010').copy(), color='red', hue='home_bytrain')
ax.set_xlabel('年份')
ax.set_ylabel('单价')
ax.set_title('2010年之后房子年份和价格的走向影响因素')
boxplot_fig = ax.get_figure()
boxplot_fig.savefig('2010年之后房子年份和价格的走向影响因素.png', dpi=400)

版权声明:本文为weixin_45920625原创文章,遵循CC 4.0 BY-SA版权协议,转载请附上原文出处链接和本声明。