python-图像金字塔及图像梯度
一、图像金字塔
1.相关概念
"""
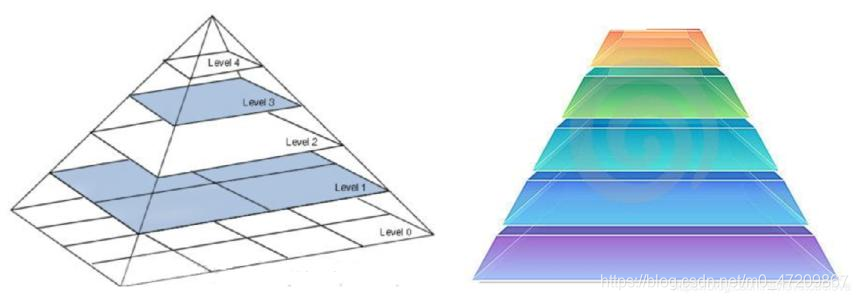
生活中有时在不同分辨率下处理(相同的)图像,例如,当在图像中搜索某个东西时,比如人脸,不确定该对象在该图像中的大小
创建一组具有不同分辨率的相同图像,并在所有这些图像中搜索对象,这些具有不同分辨率的图像集被称为图像金字塔
高斯金字塔:
高斯金字塔中的高阶(低分辨率)是通过去除低阶(高分辨率)图像中连续的行和列而形成的
向下采样
dst=cv2.pyrDown(img)
dst为目标图像
img为原始图像
注意:
1.默认输出图像大小长宽为原来的一半
2.向下采样,分辨率降低
向上采样
dst=cv2.pyrUp(img) 和向下采样参数一致
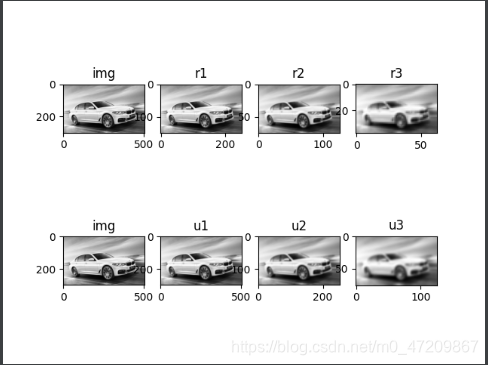
采样可逆性
一幅图像先向下采样,再向上采样,虽然会恢复为原始大小,图像看起来相似,但是像素值是不一致的
拉普拉斯金字塔:
拉普拉斯金字塔是由高斯金字塔构成,没有专门的函数,它的大部分元素都是0,用于图像压缩
它的层次是由高斯金字塔中的层次与高斯金字塔中其上层次的扩展后的层次之差形成的"""
2.高斯金字塔
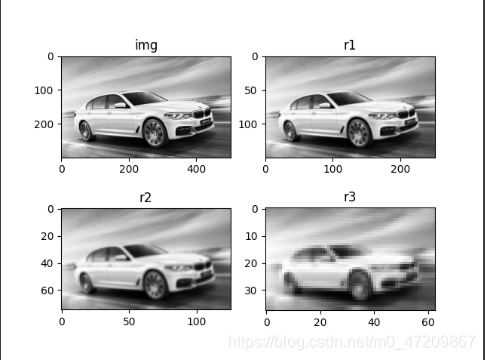
2.1 向下采样
# 向下采样
import cv2
import matplotlib.pyplot as plt
img=cv2.imread('img_2.png',0)
r1 =cv2.pyrDown(img)
r2 =cv2.pyrDown(r1)
r3 =cv2.pyrDown(r2)
print(img.shape)
print(r1.shape)
print(r2.shape)
print(r3.shape)
plt.subplot(2,2,1)
plt.imshow(img,cmap='gray')
plt.title('img')
plt.subplot(2,2,2)
plt.imshow(r1,cmap='gray')
plt.title('r1')
plt.subplot(2,2,3)
plt.imshow(r2,cmap='gray')
plt.title('r2')
plt.subplot(2,2,4)
plt.imshow(r3,cmap='gray')
plt.title('r3')
plt.show()
2.2 向上采样原理
import cv2
import numpy as np
# pyrdown原理
img1 = np.random.randint(0,10,size=100,dtype=np.uint8) # 随机创建一个数组
img1 = img1.reshape(10,10)
print(img1)
r1 = cv2.pyrDown(img1)
print(r1)

# 手动生成高斯核,可以自动生成高斯核
kernel = np.array([[1,4,6,4,1],
                   [4,16,24,16,4],
                   [6,24,36,24,6],
                   [4,16,24,16,4],
                   [1,4,6,4,1]])
kernel =kernel/256
# 高斯核与原图像进行卷积
dst = cv2.filter2D(img1,-1,kernel)
# 除去偶数行和偶数列
dst2 = np.zeros((5,5),dtype=np.uint8)
for i in range(10):
    if i%2==0:
        for j in range(10):
            if j%2==0:
                dst2[int(i/2),int(j/2)]=dst[i,j]
print(dst2)
print(r1==dst2)
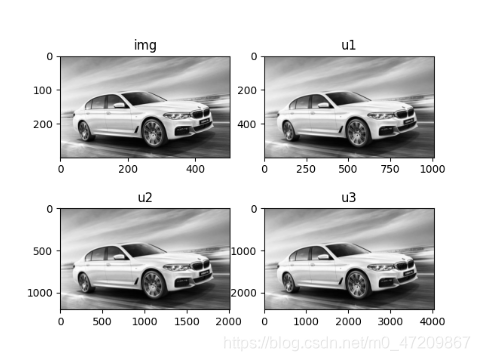
2.3 向上采样
# 向上采样
import cv2
import matplotlib.pyplot as plt
img=cv2.imread('img_2.png',0)
u1 =cv2.pyrUp(img)
u2 =cv2.pyrUp(u1)
u3 =cv2.pyrUp(u2)
plt.subplot(2,2,1)
plt.imshow(img,cmap='gray')
plt.title('img')
plt.subplot(2,2,2)
plt.imshow(u1,cmap='gray')
plt.title('u1')
plt.subplot(2,2,3)
plt.imshow(u2,cmap='gray')
plt.title('u2')
plt.subplot(2,2,4)
plt.imshow(u3,cmap='gray')
plt.title('u3')
plt.show()
2.4 采样可逆性
# 采样可逆性
import cv2
import matplotlib.pyplot as plt
img=cv2.imread('img_2.png',0)
r1 =cv2.pyrDown(img)
r2 =cv2.pyrDown(r1)
r3 =cv2.pyrDown(r2)
plt.subplot(2,4,1)
plt.imshow(img,cmap='gray')
plt.title('img')
plt.subplot(2,4,2)
plt.imshow(r1,cmap='gray')
plt.title('r1')
plt.subplot(2,4,3)
plt.imshow(r2,cmap='gray')
plt.title('r2')
plt.subplot(2,4,4)
plt.imshow(r3,cmap='gray')
plt.title('r3')
u1 =cv2.pyrUp(r1)
u2 =cv2.pyrUp(r2)
u3 =cv2.pyrUp(r3)
plt.subplot(2,4,5)
plt.imshow(img,cmap='gray')
plt.title('img')
plt.subplot(2,4,6)
plt.imshow(u1,cmap='gray')
plt.title('u1')
plt.subplot(2,4,7)
plt.imshow(u2,cmap='gray')
plt.title('u2')
plt.subplot(2,4,8)
plt.imshow(u3,cmap='gray')
plt.title('u3')
plt.show()
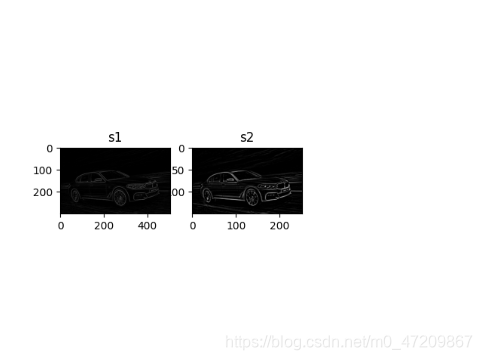
s1 =cv2.subtract(img,u1)
s2 =cv2.subtract(r1,u2)
plt.subplot(1,3,1)
plt.imshow(s1,cmap='gray')
plt.title('s1')
plt.subplot(1,3,2)
plt.imshow(s2,cmap='gray')
plt.title('s2')
plt.show()
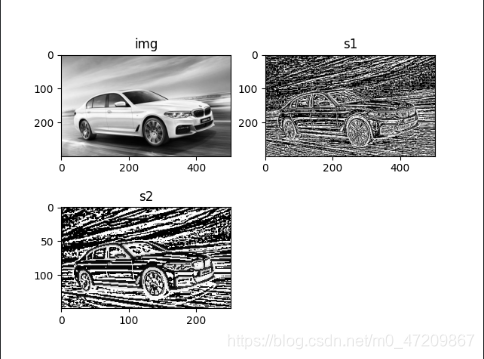
3.拉普拉斯金字塔
# 拉普拉斯金字塔
import cv2
import matplotlib.pyplot as plt
img=cv2.imread('img_2.png',0)
r1 =cv2.pyrDown(img)
r2 =cv2.pyrDown(r1)
s1 =img-cv2.pyrUp(r1)
s2 =r1-cv2.pyrUp(r2)
plt.subplot(2,2,1)
plt.imshow(img,cmap='gray')
plt.title('img')
plt.subplot(2,2,2)
plt.imshow(s1,cmap='gray')
plt.title('s1')
plt.subplot(2,2,3)
plt.imshow(s2,cmap='gray')
plt.title('s2')
plt.show()
二、图像梯度
1.相关函数
"""
sobel算子
dst = cv2.Sobel(img,depth,dx,dy,[ksize]):计算sobel算子的梯度
     dst:计算结果
     depth:处理图像深度,通常设为-1,让处理结果与原始图像保持一致
     dx:x轴方向
     dy:y轴方向
     ksize:核大小
在实际操作中,计算梯度值可能会出现负数。通常处理的图像是np.uint8类型,如果结果也是该类型,
所有负数会自动截断为0,发生信息丢失,所以,通常计算时,使用更高的数据类型cv2.CV_64F,取绝对值
后,再转换为np.uint8(cv2.CV_8U)类型,

Scharr算子
dst=cv2.Scharr(img,depth,dx,dy)等价于dst=Sobel(img,depth,dx,dy,-1)

拉普拉斯算子
dst=cv2.Laplacian(img,depth)
     dst:计算结果
     depth:处理图像深度,通常设为-1,让处理结果与原始图像保持一致

dst=cv2.convertScaleAbs(img,[,alpha[,beta]]):将原始图像img转换为256色位图
  公式:目标图像=调整(原始图像*alpha+beta)
dst=cv2.addWeighted(img1,alpha,img2,beta,gamma):计算两幅图像的权重
      dst=计算结果
      img1:源图像1
      alpha:源图像1的系数
      img2:源图像2
      beta:源图像2的系数
      gamma:修正值
"""
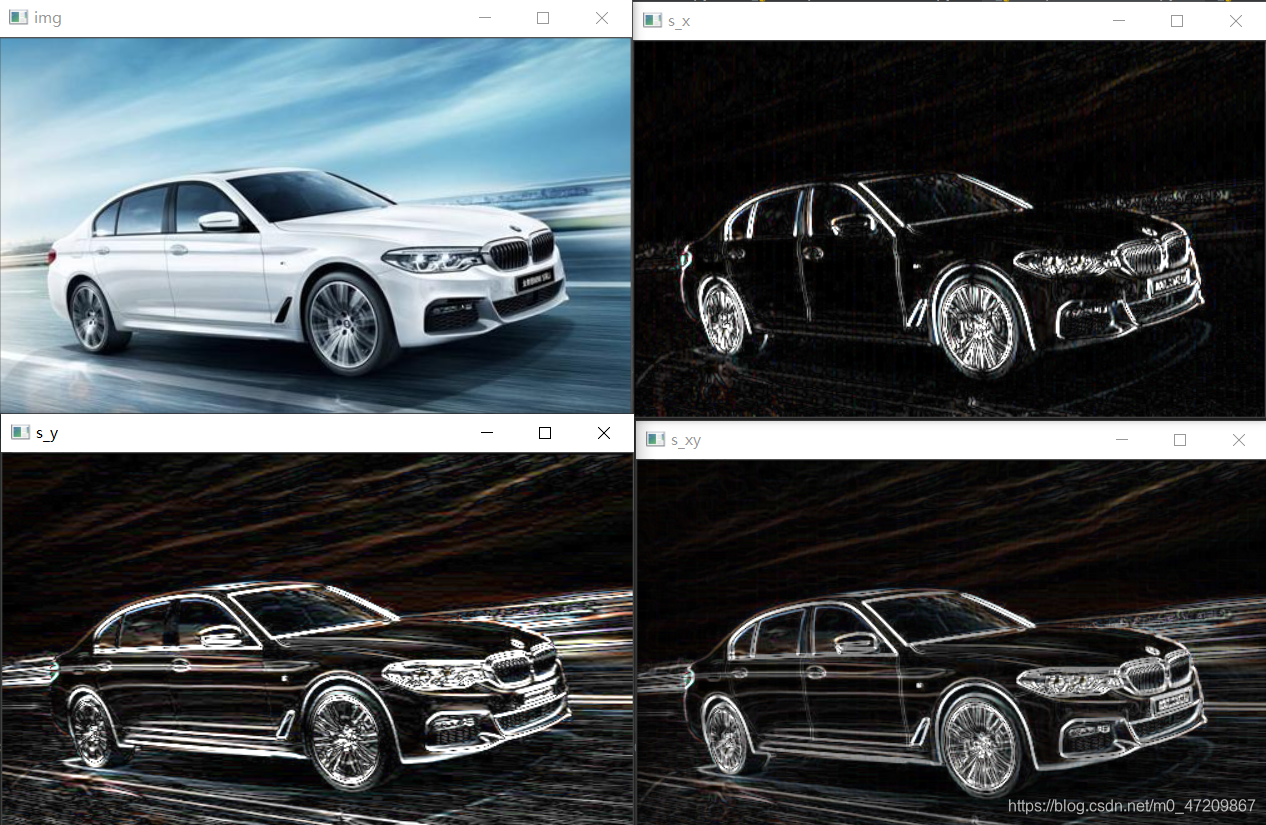
2.Sobel算子
# sobel算子
import cv2
img=cv2.imread('img_2.png')
s_x =cv2.Sobel(img,cv2.CV_64F,1,0)
s_y = cv2.Sobel(img,cv2.CV_64F,0,1)
s_x=cv2.convertScaleAbs(s_x)
s_y=cv2.convertScaleAbs(s_y)
s_xy=cv2.addWeighted(s_x,0.5,s_y,0.5,0)
cv2.imshow('img',img)
cv2.imshow('s_x',s_x)
cv2.imshow('s_y',s_y)
cv2.imshow('s_xy',s_xy)
cv2.waitKey(0)
cv2.destroyAllWindows()
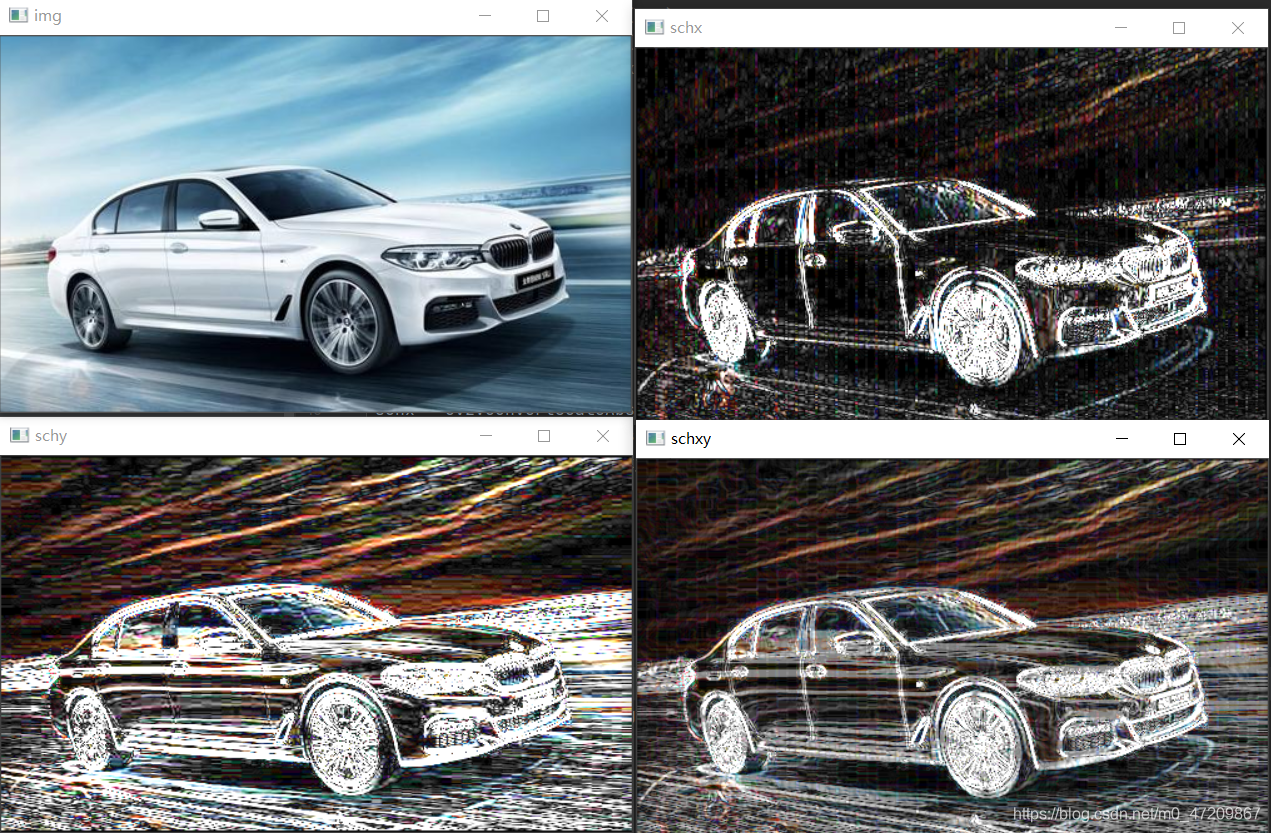
2.Scharr算子
# Scharr算子
import cv2
img=cv2.imread('img_2.png')
schx = cv2.Scharr(img,cv2.CV_64F,1,0)
schy = cv2.Scharr(img,cv2.CV_64F,0,1)
schx = cv2.convertScaleAbs(schx)  # 转回uint8
schy = cv2.convertScaleAbs(schy)
schxy=cv2.addWeighted(schx,0.5,schy,0.5,0)
cv2.imshow('img',img)
cv2.imshow('schx',schx)
cv2.imshow('schy',schy)
cv2.imshow('schxy',schxy)
cv2.waitKey(0)
cv2.destroyAllWindows()
3.Laplacian算子
# 拉普拉斯算子
import cv2
img=cv2.imread('img_2.png',0)
la = cv2.Scharr(img,cv2.CV_64F,1,0)
la = cv2.convertScaleAbs(la)  # 转回uint8
cv2.imshow('img',img)
cv2.imshow('la',la)
cv2.waitKey(0)
cv2.destroyAllWindows()

版权声明:本文为m0_47209867原创文章,遵循CC 4.0 BY-SA版权协议,转载请附上原文出处链接和本声明。