1. 写在前面
流程图可以帮我们梳理平时工作项目的逻辑与思绪。目前有很多软件可以画流程图,像PPT, WORD,inkscape等等。界面式软件虽好,但是一旦涉及到重复性工作的时候,往往会重新操作一遍。我想想就心累。而且学习有GUI的软件对于我来说反而很痛苦。像被科研人所熟悉的EndNote,到目前为止,我也不大会用。现在写论文开始转向Rmarkdown。因为有界面的软件反而是个黑匣子,一旦报错,很难debug。而像Rmarkdown,Latex可以用符号代码来代替界面的操作命令,报错后反而可以较快解决。只要上手了,后面反而更加让人爱不释手。长久来看,用这些语言来写作是可以提高效率的。全部用代码实现写作是我之前定下的一个小目标。现在基本实现。所以像流程图这种东西用代码实现也必须是做得到的。
2. 流程图R包
今天要记录的是一款叫DiagrammeR的R包。然而只用到了里面的一个函数。
2.1 安装
安装很简单,用install.packages即可。在这再记录下,对于R包安装现在很多情况是网络不给力,常常下载不了或者下到中间断掉,然后再安装就可能会报错。可以参考这两篇,一篇是添加镜像源。一篇是R包安装常碰到的问题。
install.packages("DiagrammeR")
2.2 例子
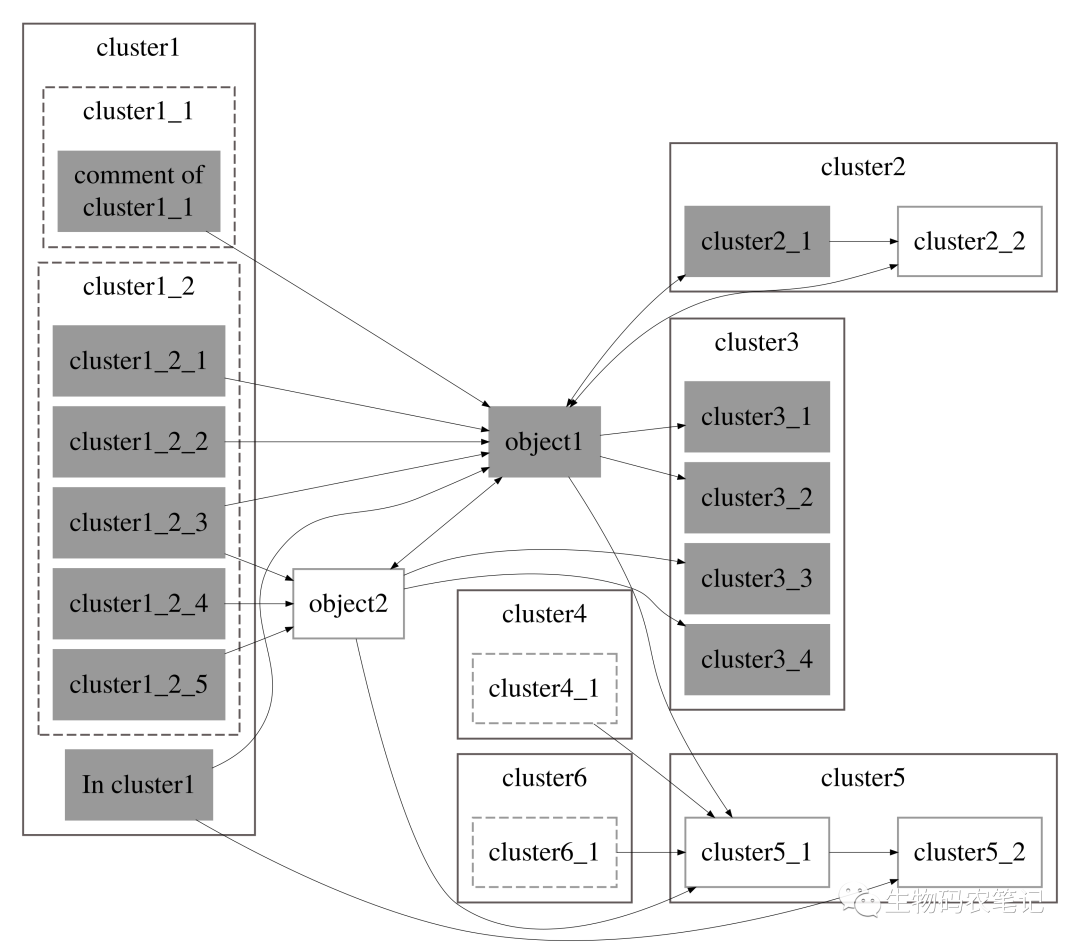
这个包里面含有200多个函数,要每个都去了解也不现实。而且今天记录的用它画流程图也只是用到一个grViz函数,其他的其实是用GraphViz中的DOT language来实现的。所以了解一些GraphViz的DOT Language反而比DiagrammeR更有效。GraphViz是一款开源的图形可视化软件,在生物信息学,软件开发,数据库等等具有重要应用。目前,我对DOT Language以及DiagrammeR的了解并不深(因为我也只是要满足用代码画流程图的需求而已,深挖也没必要),只限于看到某个流程图,我觉得应该可以用DiagrammeR来实现。比如以我们课题组今年发在Molecular Biology and Evolution上的treeio那篇文章中的关系图为例。
library(DiagrammeR)
library(DiagrammeRsvg)
# grViz 是DiagrammeR中的一个函数。其实是调用了htmlwidgets的createWidget来生成图表。但这个例子里的代码都是基于`GraphViz`的`DOT Language`。
# digraph即创建一个有向图
x "digraph {
# 声明graph然后[]中为该graph的属性。compound为true时则后面的edge的连接可以通过ltail,lhead来指定某个cluster
# nodesep为点之间的间隔。
graph [compound = true, nodesep=0.08]
# left to right 相应的还有TB top to bottom (默认)
rankdir=LR
subgraph cluster1{
label = 'cluster1';
style = solid;
color = '#625a5a';
    subgraph clustersub1{
    label = 'cluster1_1';
    # 边框的类型有`dashed`, `solid`, `rounded`, `dotted`可选,可以用逗号进行叠加
    style = 'dashed';
    color = '#625a5a';
    # shape即为点的形状类型有circle,diamond等可选。
    node [shape=box, style=filled, color=grey60, fillcolor = 'grey60'];
    n0[label='comment of\ncluster1_1']
    }

    subgraph clustersub2{
    label='cluster1_2';
    style='dashed';
    color='#625a5a';
    node [shape=box, style=filled, color=grey60, fillcolor = 'grey60']
    n1[label='cluster1_2_1']
    n2[label='cluster1_2_2']
    n3[label='cluster1_2_3']
    n4[label='cluster1_2_4']
    n5[label='cluster1_2_5']
    }
node [shape=box, style=filled, color=grey60, fillcolor = 'grey60']
n6[label='In cluster1']
}

subgraph cluster2{
label = 'cluster2';
style = solid;
color = '#625a5a';
node [shape=box, style=filled, color=grey60, fillcolor = 'grey60']
n7[label = 'cluster2_1']
node [shape=box, style=filled, color=grey60, fillcolor = 'white']
n8[label = 'cluster2_2']
# penwidth 定义edge的width,arrowsize定义箭头大小,
# 相应的还有箭头类型可以通过arrowhead来指定
n7 -> n8 [penwidth=0.3, arrowsize=0.4]
}

subgraph cluster3{
label = 'cluster3'
style=solid;
color = '#625a5a';
node [shape=box, style=filled, color=grey60, fillcolor = 'grey60']
n9[label='cluster3_1']
n10[label='cluster3_2']
n11[label='cluster3_3']
n12[label='cluster3_4']

}

subgraph cluster4{
label = 'cluster4'
style=solid;
color = '#625a5a';
node [shape=box, style=dashed, color=grey60, fillcolor = 'white']
n13[label='cluster4_1']
}

subgraph cluster5{
label = 'cluster5'
style=solid;
color = '#625a5a';
node [shape=box, style=filled, color=grey60, fillcolor = 'white']
n14[label='cluster5_1']
n15[label='cluster5_2']
n14 -> n15 [penwidth=0.3, arrowsize=0.4]
}

subgraph cluster6{
label = 'cluster6';
style = solid;
color = '#625a5a';
node [shape=box, style=dashed, color=grey60, fillcolor = 'white']
n16[label='cluster6_1']
}

subgraph cluster7{
style = invis;
node [shape=box, style = filled, color=grey60, fillcolor = 'white'];
n17[label='object2']
}

subgraph cluster8{
style = invis
node [shape=box, style = filled, color=grey60, fillcolor = 'grey60'];
n18[label='object1']
}
# dir=both为两点双向互相连接
n17 -> n18 [dir=both, penwidth=0.3, arrowsize=0.4]
{n0 n1 n2 n3 n6} -> n18 [penwidth=0.3, arrowsize=0.4]
{n3 n4 n5} -> n17 [penwidth=0.3, arrowsize=0.4]
{n18} -> {n7 n8} [dir=both, penwidth=0.3, arrowsize=0.4]
{n18} -> {n9 n10 n14} [penwidth=0.3, arrowsize=0.4]
{n17} -> {n11 n12 n14} [penwidth=0.3, arrowsize=0.4]
{n13 n16} -> n14 [penwidth=0.3, arrowsize=0.4]
n6 -> n15 [penwidth=0.3, arrowsize=0.4]
n6 -> n17 [style=invis]
n17 -> n13 [style=invis]
}
")
# 以下为生成Fig.svg文件,当然也可以用将DOT代码写到一个.gv的文件中后,去掉注释用
# dot -Tsvg test.gv -o Fig.svg
export_svg(x) %>% charToRaw %>% rsvg::rsvg_svg('./Fig.svg')
3. 总结
上面流程图只是一个例子,要想绘制自己想要的流程图,除了要了解代码,最关键的是要知道整个流程的逻辑。更多的DOT Language请参考https://graphviz.gitlab.io/_pages/pdf/dotguide.pdf
4. 往期精彩回顾
- 《嫌R计算太慢?试试Rcpp--入门篇》
- 《windows下多版本的R以及Rtools编译环境配置》
- 《一个可以画星星图层的R包,了解下》
- 《助力微生物组学分析--实验室新R包MicrobiotaProcess》