作为一个近乎小白的新玩家,旁听的这个课又无法提交,想来想去还是发出来留个纪念嘻嘻。
Assignment 4 - Hypothesis Testing
This assignment requires more individual learning than previous assignments - you are encouraged to check out the pandas documentation to find functions or methods you might not have used yet, or ask questions on Stack Overflow and tag them as pandas and python related. And of course, the discussion forums are open for interaction with your peers and the course staff.
Definitions:
- A quarter is a specific three month period, Q1 is January through March, Q2 is April through June, Q3 is July through September, Q4 is October through December.
- A recession is defined as starting with two consecutive quarters of GDP decline, and ending with two consecutive quarters of GDP growth.
- A recession bottom is the quarter within a recession which had the lowest GDP.
- A university town is a city which has a high percentage of university students compared to the total population of the city.
Hypothesis: University towns have their mean housing prices less effected by recessions. Run a t-test to compare the ratio of the mean price of houses in university towns the quarter before the recession starts compared to the recession bottom. (price_ratio=quarter_before_recession/recession_bottom)
The following data files are available for this assignment:
- From the Zillow research data site there is housing data for the United States. In particular the datafile for all homes at a city level,
City_Zhvi_AllHomes.csv, has median home sale prices at a fine grained level. - From the Wikipedia page on college towns is a list of university towns in the United States which has been copy and pasted into the file
university_towns.txt. - From Bureau of Economic Analysis, US Department of Commerce, the GDP over time of the United States in current dollars (use the chained value in 2009 dollars), in quarterly intervals, in the file
gdplev.xls. For this assignment, only look at GDP data from the first quarter of 2000 onward.
Each function in this assignment below is worth 10%, with the exception of run_ttest(), which is worth 50%.
Question 1
Returns a DataFrame of towns and the states they are in from the university_towns.txt list. The format of the DataFrame should be:DataFrame( [ ["Michigan", "Ann Arbor"], ["Michigan", "Yipsilanti"] ], columns=["State", "RegionName"] )
The following cleaning needs to be done:
1. For "State", removing characters from "[" to the end.
2. For "RegionName", when applicable, removing every character from " (" to the end.
3. Depending on how you read the data, you may need to remove newline character '\n'. '''
def get_list_of_university_towns():
    unitown=pd.read_table('university_towns.txt', header=None)
    stateindex=[]
    for i in range(len(unitown)):
        if '[edit]' in unitown[0][i]:
            stateindex.append(i)
    stateindex.append(len(unitown))#防止后面的循环溢出
    statename=[]
    for j in range(len(stateindex)-1):
        for i in range(len(unitown)):
            if i>=stateindex[j] and i<stateindex[j+1]:
                statename.append(unitown[0][stateindex[j]].replace('[edit]',''))
    unitown['State']=statename
    unitown=unitown.drop(stateindex[:-1])
    unitown['RegionName']=unitown.apply(lambda x: x.replace(to_replace=r'\s\(.+', value='', regex=True))[0]
    return unitown.drop(0, axis=1)
get_list_of_university_towns()

Question 2
Returns the year and quarter of the recession start time as a string value in a format such as 2005q3
# 为下面计算recession的start,end,bottom 做准备
gdplev=pd.read_excel('gdplev.xls', skiprows=218, usecols=[4,6], names=['Quarter','GDP'])
growth=[np.nan]
for i in range(1,len(gdplev)):
    if gdplev['GDP'][i]>gdplev['GDP'][i-1]:
        growth.append(1)
    else:
        growth.append(0)
for i in range(3, len(growth)):
    if growth[i-1]==1 and growth[i]==1:
        if growth[i-2]==0 and growth[i-3]==0:
            end=gdplev['Quarter'][i]
            end_index=i
            for j in range(4,i+1):
                if growth[i-j]==1:
                    start=gdplev['Quarter'][i-j+1]
                    start_index=i-j+1
                    break
def get_recession_start():
return start
get_recession_start()![]()
Question 3
Returns the year and quarter of the recession end time as a string value in a format such as 2005q3
def get_recession_end():
    return end
get_recession_end()![]()
Question 4
Returns the year and quarter of the recession bottom time as a string value in a format such as 2005q3
bottom_index=gdplev.iloc[start_index:end_index]['GDP'].idxmin()
bottom=gdplev['Quarter'][bottom_index]
def get_recession_bottom():
    return bottom
get_recession_bottom()![]()
Question 5
Converts the housing data to quarters and returns it as mean values in a dataframe. This dataframe should be a dataframe with columns for 2000q1 through 2016q3, and should have a multi-index in the shape of ["State","RegionName"].
Note: Quarters are defined in the assignment description, they arenot arbitrary three month periods.
The resulting dataframe should have 67 columns, and 10,730 rows.
def convert_housing_data_to_quarters():
    housing=pd.read_csv('City_Zhvi_AllHomes.csv', header=None)
    housing=housing.iloc[:,1:3].merge(housing.iloc[:, 51:], left_index=True, right_index=True)
    housing=housing.replace(housing.iloc[0][2:],housing.iloc[0][2:].apply(pd.to_datetime).dt.to_period('q'))
    housing.iloc[0][2:]=housing.iloc[0][2:].apply(lambda x: str(x).replace('Q', 'q'))
    housing=housing.T.set_index(0).T
    housing=housing.apply(lambda x: pd.to_numeric(x, errors='ignore'))#转换string数据,否则无法计算.mean()
    h=housing.iloc[:, 2:]
    h=h.groupby(level=0, axis=1).mean()
    housing['State']=housing['State'].replace(states)
    return h.set_index([housing['State'],housing['RegionName']])
convert_housing_data_to_quarters()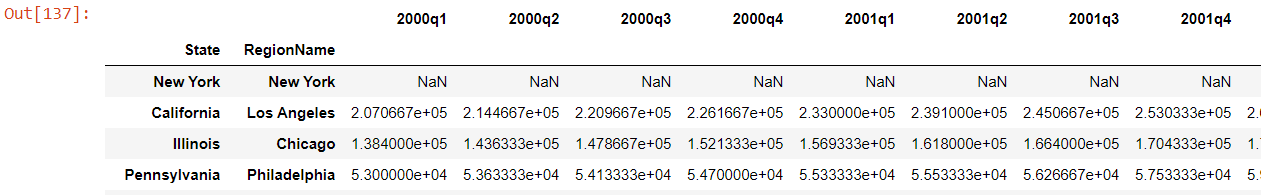

Question 6
First creates new data showing the decline or growth of housing prices between the recession start and the recession bottom. Then runs a ttest comparing the university town values to the non-university towns values, return whether the alternative hypothesis (that the two groups are the same) is true or not as well as the p-value of the confidence.
Return the tuple (different, p, better) where different=True if the t-test is True at a p<0.01 (we reject the null hypothesis), or different=False if otherwise (we cannot reject the null hypothesis). The variable p should be equal to the exact p value returned from scipy.stats.ttest_ind(). The value for better should be either "university town" or "non-university town" depending on which has a lower mean price ratio (which is equivilent to a reduced market loss).'''
def run_ttest():
    housing=convert_housing_data_to_quarters()
    price=pd.DataFrame(housing[get_recession_bottom()]-housing[get_recession_start()], columns=['delta_price'])
    university_towns=get_list_of_university_towns()
    # method 1
    university_towns['test']=university_towns['State']+university_towns['RegionName']
    price=price.reset_index()
    price['Is_utowns']=price.apply(lambda x: x[0]+x[1] in list(university_towns['test']), axis=1)
    # method 2
    # university_towns['Is_utowns']=True
    # university_towns.set_index(['State', 'RegionName'], inplace=True)
    # price=pd.merge(price, university_towns, how='left', left_index=True, right_index=True).fillna(False)
    price_u=price[price['Is_utowns']==True]['delta_price']
    price_nu=price[price['Is_utowns']==False]['delta_price']
    statistic, pvalue=ttest_ind(price_u, price_nu, nan_policy='omit')
    if pvalue <0.01:
        different=True
    else:
        different=False
    if price_u.mean() > price_nu.mean(): #因为delta_price是用bottom减去start
        better='university town'
    else:
        better='non-university town'
    return (different, pvalue, better)
run_ttest()![]()