前面我们的数据大部分都是由节点上的agent端收集本地数据后暴露到/metrics,再由prometheus pull到本地进行存储展示的
但是终归这种指标收集的方法是有局限性的,并且有可能被其他如防火墙等安全机制拦截,又或者我们的client端并不能采集到我们想要的指标
那么在这种情况下,我们可以通过一个工具Pushgateway 来进行代理,将其他区域或自定义的指标收集并提交到prometheus上
一. 部署pushgateway
#拉取软件包
wget https://github.com/prometheus/pushgateway/releases/download/v1.4.0/pushgateway-1.4.0.linux-amd64.tar.gz

#我的包
链接:https://pan.baidu.com/s/1U2uhZB051KiUg_hsw5aS4A
提取码:1111
#----------------------------------------------------------------------------------#

#解压
tar -zxvf pushgateway-1.4.0.linux-amd64.tar.gz

#拷贝二进制文件
cp pushgateway-1.4.0.linux-amd64/pushgateway  /usr/bin/


#添加服务文件
cat > /usr/lib/systemd/system/pushgateway.service <<EOF
[Unit]
Description=pushgateway
Documentation=https://github.com/prometheus/pushgateway
After=network.target

[Service]
ExecStart=/usr/bin/pushgateway
Restart=on-failure

[Install]
WantedBy=multi-user.target
EOF
启动服务
systemctl daemon-reload
systemctl enable pushgateway
systemctl start pushgateway
systemctl status pushgateway
访问
http://192.168.1.20:9091/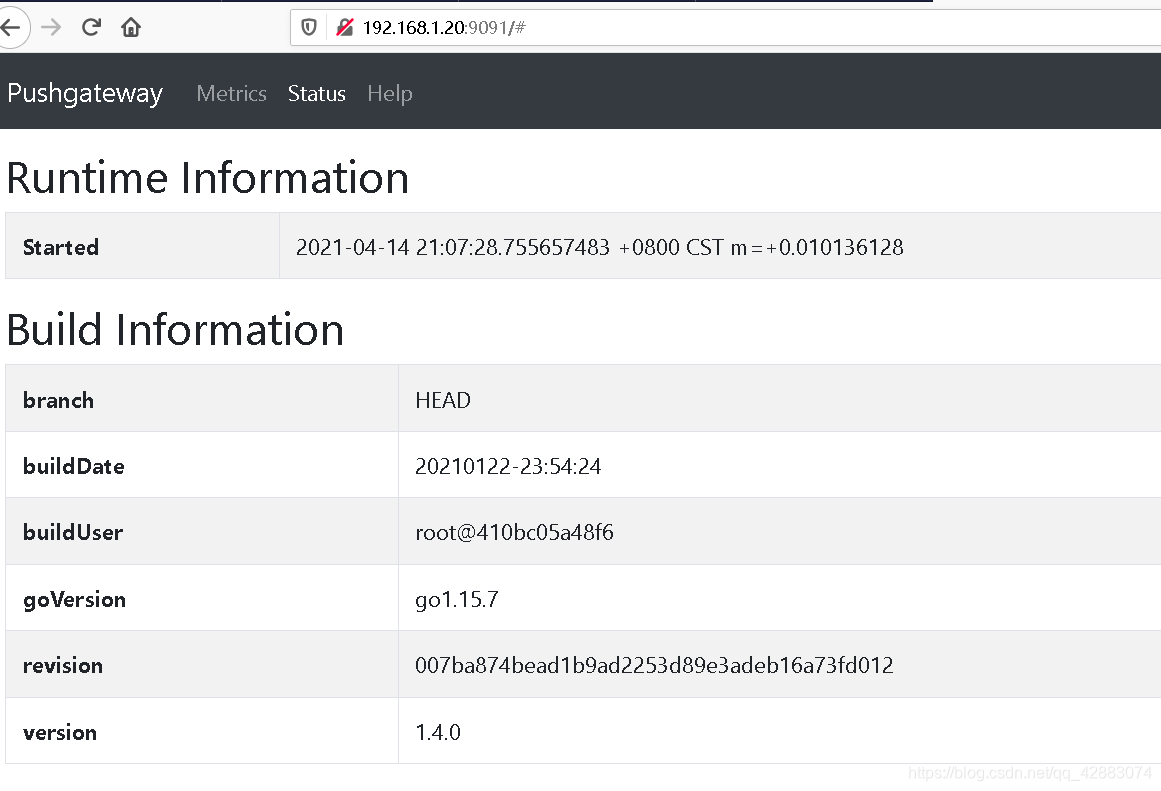
二. 添加prometheus抓取
#添加监控配置
cat >> /etc/prometheus/prometheus.yml <<EOF
  - job_name: pushgateway
    honor_labels: true
    file_sd_configs:
      - files:
        - targets/pushgateway/*.json
        refresh_interval: 5m
EOF

#创建目录
mkdir /etc/prometheus/targets/pushgateway -p

#添加监控节点
cat >  /etc/prometheus/targets/pushgateway/test1.json <<EOF
[{
    "targets": ["192.168.1.20:9091"]
}]
EOF
说明
#说明
1. honor_labels
  #true   #当为true时,prometheus在拉取时会使用pushgateway上的job名称和instance的标签
  #false  #当为false时,prometheus在拉取时会添加exported_的前缀,并在服务器上为这些标签添加新值

2. refresh_interval    #服务发现间隔
重载服务
systemctl restart prometheus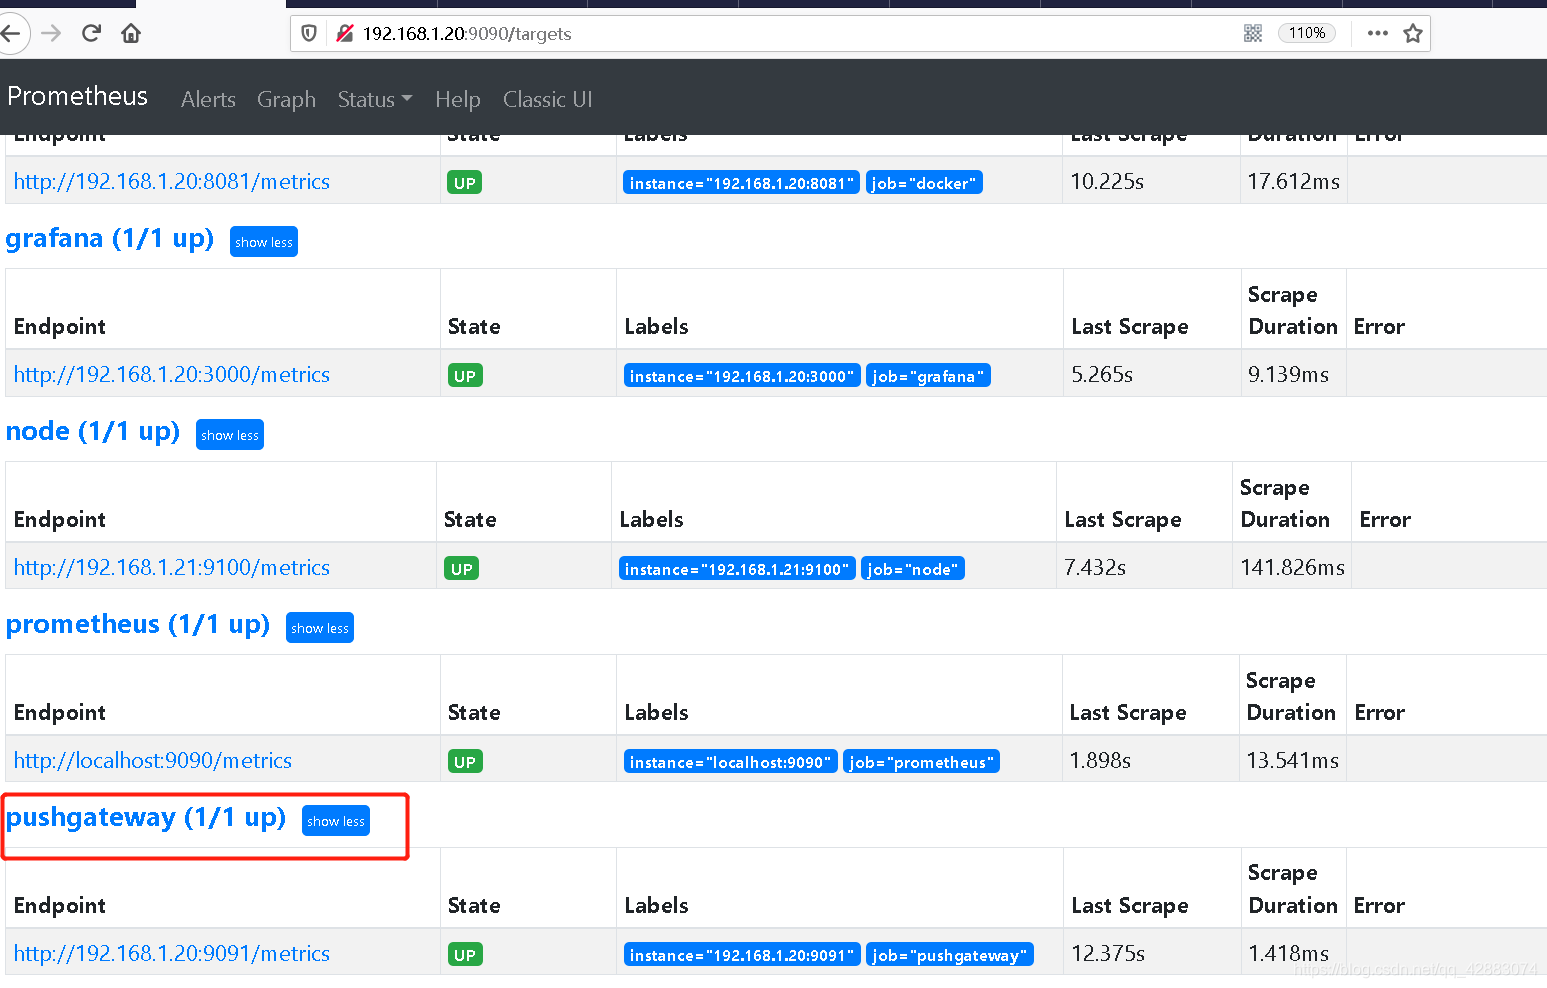
三. 数据推送
pushgateway仅仅起到了一个代理的作用,我们需要将指标"post"到pushgateway后再由prometheus去采集
格式
http://<ip>:9091/metrics/job/<JOBNAME>{/<LABEL_NAME>/<LABEL_VALUE>}案例1 简单推送
#格式
http://<ip>:9091/metrics/job/<JOBNAME>{/<LABEL_NAME>/<LABEL_VALUE>}

#我们推送一个指标做测试
echo 'metrics_name 1'  | curl --data-binary @- http://192.168.1.20:9091/metrics/job/test1/
说明
#metrics_name 1    #指标名称:值   也就是我们提交上数据的值
#/job/test1/ #标签的名称和值,按照顺序以/隔开会组成一对,可以设置多个标签 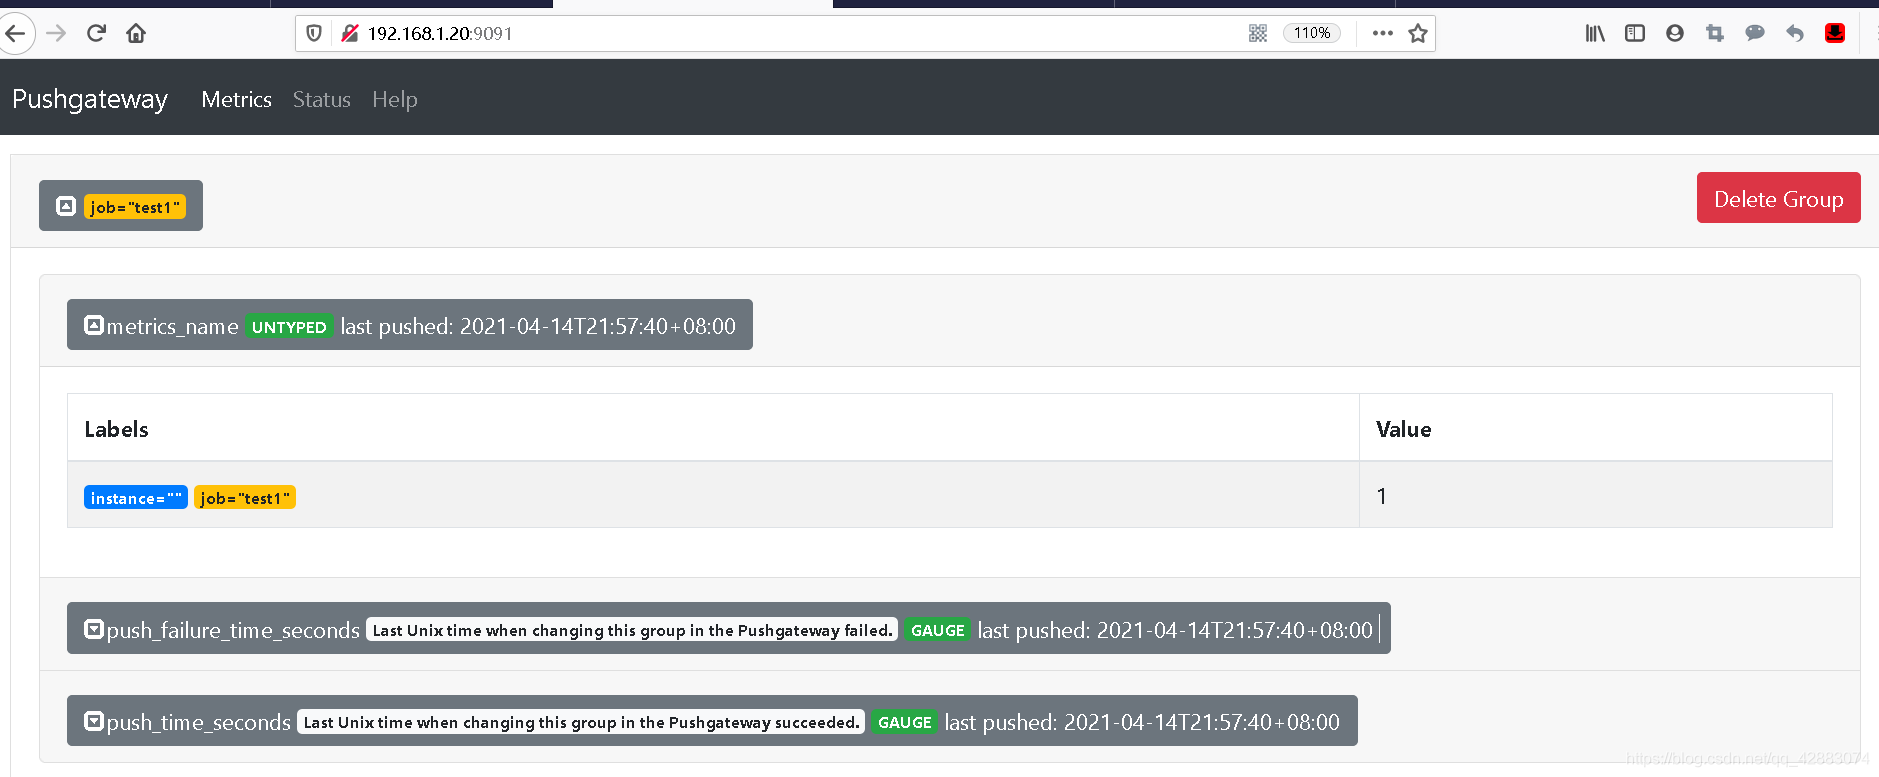
我们可以看到,除了我们上传的指标,还多了两个指标 push_time_seconds 和 push_failure_time_seconds
他们的作用就是用来表示上一次抓取成功/失败的时间。也会随之被promethues拉取到
案例2 推送时添加多个指标
#设置多个标签推送
echo 'metrics_name2 2' | curl --data-binary @- http://192.168.1.20:9091/metrics/job/test1/instance/192.168.1.20/mode/test2/haha/test3 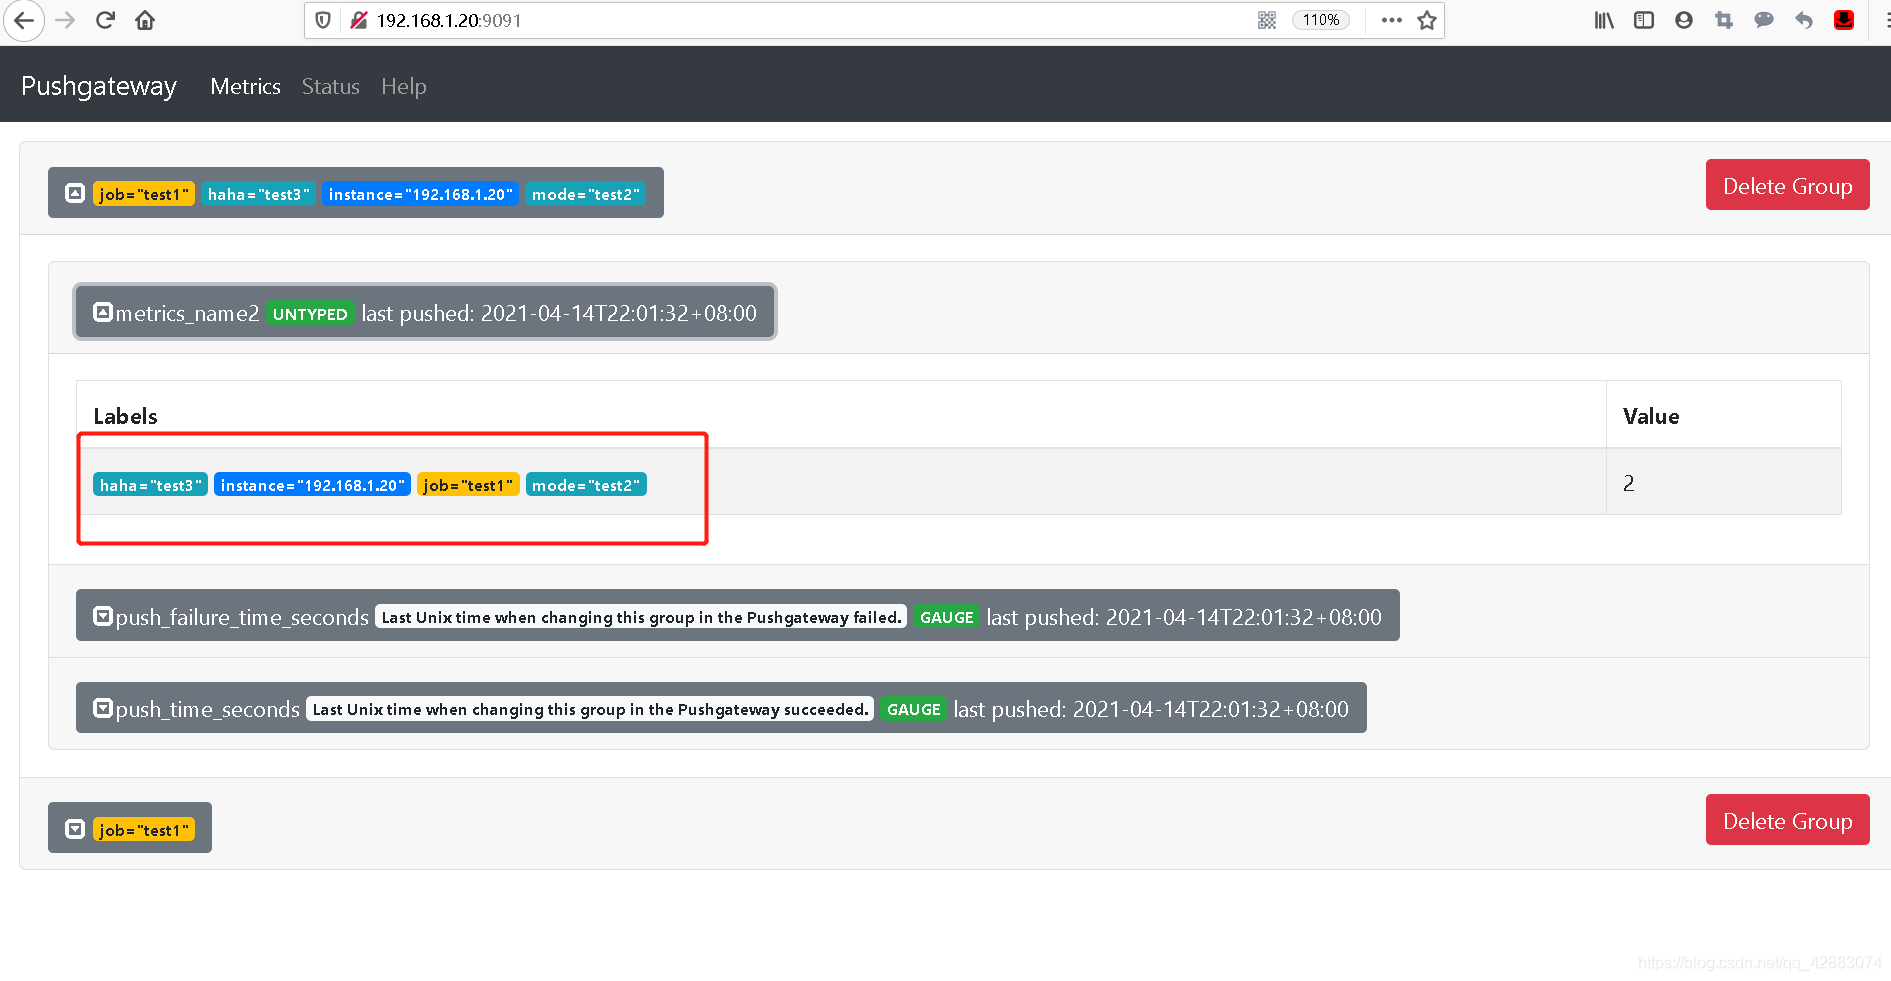
我们现在可以去prometheus查看我们推送的值了
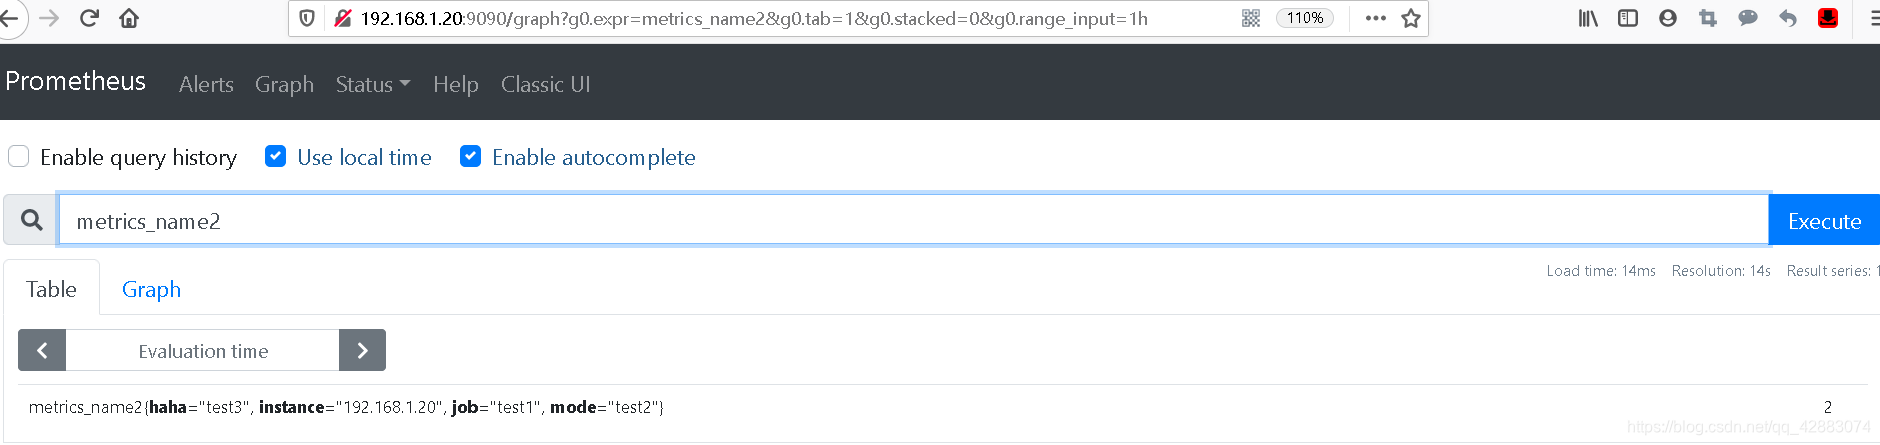
单个指标的作用很小,当有多个标签的时候前面的方法有很麻烦,我们来添加多个标签
案例3 推送多个指标
#添加多个指标
cat <<EOF | curl --data-binary @- http://192.168.1.20:9091/metrics/job/test/instance/192.168.1.20
metrics_name10{code="200"} 1
metrics_name11{code="404"} 1
metrics_name12{code="503"} 1
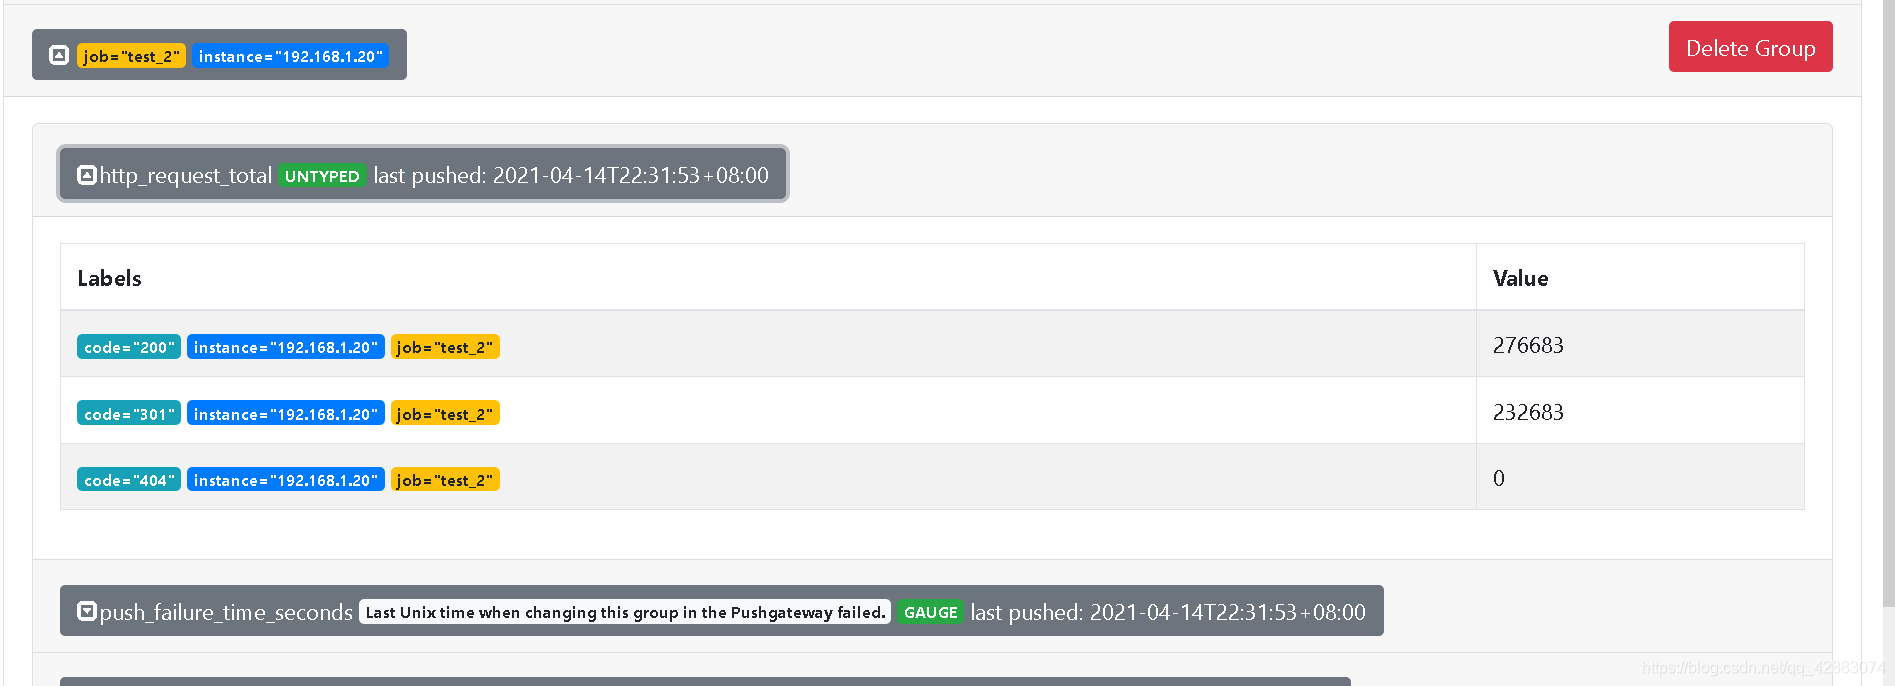
EOF案例4 基于文件推送
#添加指标文件
cat > test.json <<EOF
http_request_total{code="200"} 276683
http_request_total{code="301"} 232683
http_request_total{code="404"} 0
EOF

#推送
curl -XPOST --data-binary @test.json http://127.0.0.1:9091/metrics/job/test_2/instance/192.168.1.20
案例5 删除标签
#需要写上完整的标签名称
curl -X DELETE http://192.168.1.20:9091/metrics/job/test/instance/192.168.1.20
版权声明:本文为qq_42883074原创文章,遵循CC 4.0 BY-SA版权协议,转载请附上原文出处链接和本声明。