echarts 柱状图&&折线图切换展示

在这里插入图片描述

<template>
    <div>
        <div id="echarts" style="width:600px;height:200px;margin:50px auto;"></div>
    </div>
</template>
<script>
import * as echarts from 'echarts';
export default {
    data() {
        return {}
    },
    created() { },
    mounted() {
        this.typeCharts0()
    },
    methods: {
        typeCharts0() {
            let option = this.getOption();
            var chartDom = document.getElementById('echarts');
            var myChart = echarts.init(chartDom);
            myChart.setOption(option, true);
        },
        getOption(data) {
            let summary = {
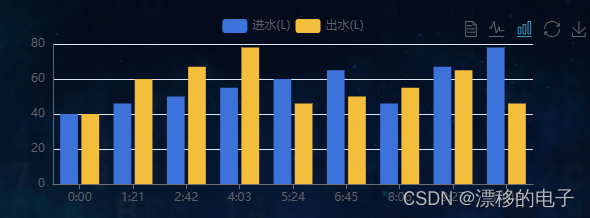
                color: ["#3E72DB", "#F4BE3D"],
                legend_data: ['进水(L)', '出水(L)'],
                xAxis:
                {
                    type: 'category',
                    axisTick: {
                        alignWithLabel: true
                    },
                    data: ['0:00', '1:21', '2:42', '4:03', '5:24', '6:45', '8:06', '9:27', '10:48'],
                    axisLabel: { //
                        textStyle: {
                            color: '#61646a',
                        }
                    }
                },
                yAxis: [
                    {
                        type: 'value',
                        name: '',
                        position: 'left',
                        alignTicks: true,
                        axisLine: {
                            show: true,
                            lineStyle: {
                                color: '#61646a'
                            }
                        },
                        axisLabel: {
                            formatter: '{value}'
                        }
                    }
                ],
                series_data: [
                    {
                        name: '进水(L)',
                        type: 'bar',
                        // type: 'line',
                        data: [40, 46, 50, 55, 60, 65, 46, 67, 78]
                    },
                    {
                        name: '出水(L)',
                        type: 'bar',
                        // type: 'line',
                        data: [40, 60, 67, 78, 46, 50, 55, 65, 46]
                    }
                ]
            };
          let  option = {
                color: summary.color,
                tooltip: {
                    trigger: 'axis',
                    axisPointer: {
                        type: 'shadow',
                        label: {
                            show: true
                        }
                    }
                },
                grid: {
                    left: '10%',
                    top: '30px',
                    bottom: '30px',
                    right: '10%'
                },
                toolbox: {//图形转换
                    feature: {
                        dataView: {
                            show: true,
                            readOnly: false
                        },
                        magicType: {
                            show: true,
                            type: ['line', 'bar']
                        },
                        restore: {
                            show: true
                        },
                        saveAsImage: {
                            show: true
                        }
                    }
                },
                legend: { 
                    orient: 'horizontal',
                    x: 'center',
                    y: 'top',
                    itemGap: 5,                   
                    textStyle: {
                        color: '#61646a'        
                    },
                    data:summary.legend_data,
                },
                xAxis: summary.xAxis,
                yAxis: summary.yAxis,
                series: summary.series_data
            }
            return option;
        }

    }
}
</script>

版权声明:本文为weixin_40030173原创文章,遵循CC 4.0 BY-SA版权协议,转载请附上原文出处链接和本声明。