要求:
统计客户端目前的系统版本
实现:
	1.查表取得数据
	2.plt绘制出柱形图
# coding: utf8
import MySQLdb
import json
import pandas as pd
import numpy as np
import time
import matplotlib.pyplot as plt
import pylab
from PIL import Image

import random
"""
////pro
// var (
//     dbhostsip = ""
//     dbusername = ""
//     dbpassowrd = ""
//     dbname     =  "aiot"
// )
"""

def getcurrentversion():
    # 打开数据库连接
    db = MySQLdb.connect("my, "root", "123456","datacenter")
    # 使用cursor()方法获取操作游标
    cursor = db.cursor()

    # SQL 查询语句
    sql = "SELECT current_ota_version FROM aiot_analysis.device_runtime where model=30100"

    #try:
    # 执行SQL语句
    cursor.execute(sql)
    # 获取所有记录列表
    results = cursor.fetchall()
    print "查询到%d" %len(results)
    tempdic= {}
    cot=0
    templist=[]
    for i in range(len(results)):
        temp = str(results[i]).encode("utf-8")#将unicode编码成str
        temp=temp.lstrip("('")
        temp=temp.rstrip("',)")#去掉多余字符
        templist.append(temp)
    for i in range(len(templist)):
        tempdic[templist[i]]= templist.count(templist[i])
    for i in tempdic:
        cot = cot+tempdic[i]
    print "计数count:%d" %cot

    d_order=sorted(tempdic.iteritems(),key=lambda x:x[0],reverse=False)
    print "聚合后:%d" %len(d_order)


    db.commit()
    # 关闭数据库连接
    db.close()
    return d_order

def Showfig(version):
    ver ={}
    datalist=[]
    countlist=[]
    for i in range(len(version)):
        temp1=version[i][0]
        if temp1=="":
            temp1 ="null"
        # sel = ("D","T")#不统计T,D版本
        if temp1.endswith(("D","T")):#如果检测多个,则放在tuple(第一个参数是str/tuple)
            continue
        datalist.append(temp1)
        countlist.append(version[i][1])
    ver["data"]=datalist
    ver["count"]=countlist
    print "去掉D,T版本后:%d" %len(ver["data"])
    print "画图..."
    fig = plt.figure()
    ax1 = fig.add_subplot() # 画2行1列个图形的第1个
    bar_width = 0.6#bar 宽度值,柱子不显示可尝试调整宽度

    z1=plt.bar(ver["data"],ver["count"],bar_width,tick_label=ver["data"],label='version',fc='r',)#第一个bar
    for a, b in zip(ver["data"], ver["count"]):#zip将传入的数据打包成元祖,循环添加数字
        plt.text(a, b + 0.05, '%.0f' % b, ha='center', va='bottom', color='b',fontsize=10)#标注的x轴起点,y轴起点,float位数,水平位置,垂直位置,颜色,字体大小)
    fig.autofmt_xdate()#主动调节X轴标注,避免拥挤
    plt.legend(loc='upper right')#显示图注,不调用legend()方法设置了labe也不会显示
    plt.savefig('version_count.png')
    plt.show()

if __name__ == '__main__':

    version=getcurrentversion()
    Showfig(version)

    # str = "this is string example....wow!!!"
    # # 这是区分大小写的,如果是Wow!!!则是False
    # suffix = "wow!!!"
    # print(str.endswith(suffix))
    # # 这里不用从20开始,从10也是True,因为wow是在它们之后才出现
    # print(str.endswith(suffix,10))
    # print len(str)
    # suffix = "is"
    # print(str.endswith(suffix, 1, 4))
    # print str[1:6]#his i
    # print(str.endswith(suffix, 1, 6))#注意闭区间
    ```
```r
在这里插入代码片
图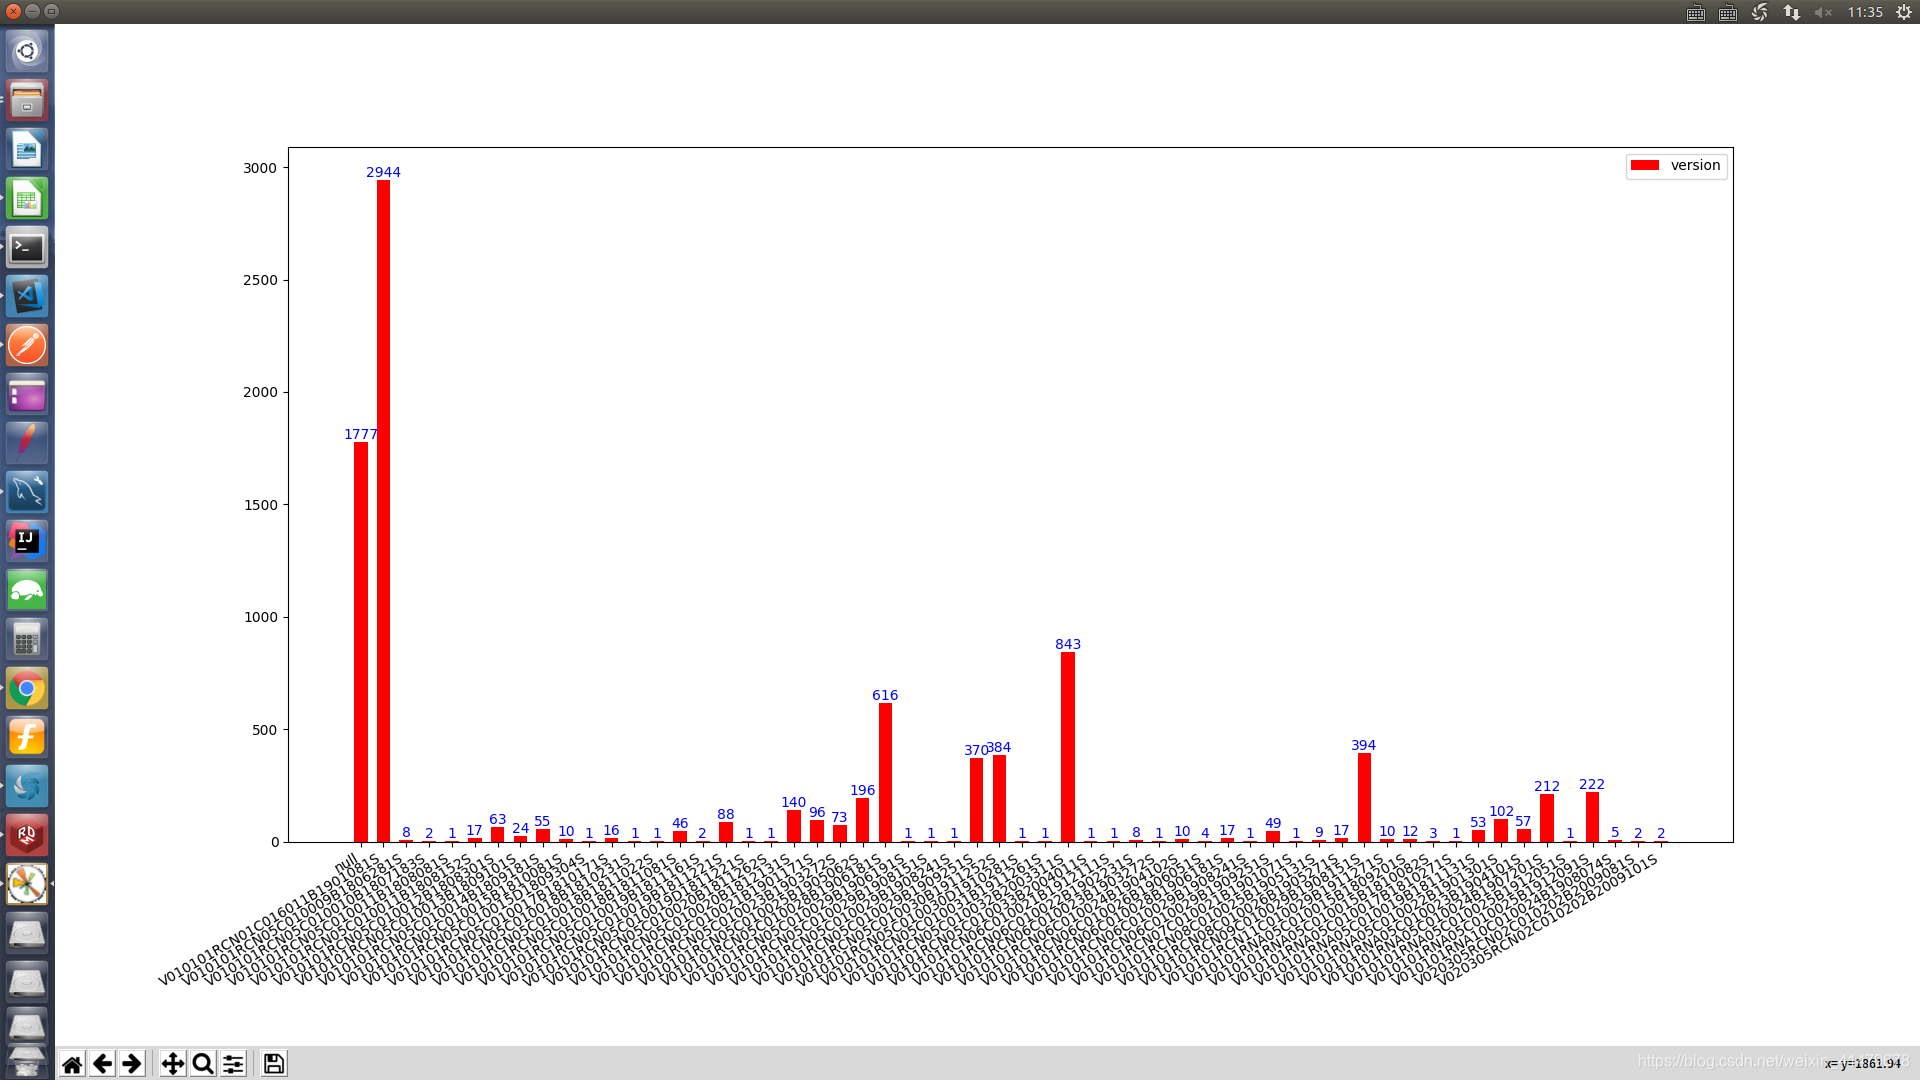
有点密恐 有空再format下版本的string
版权声明:本文为weixin_41479678原创文章,遵循CC 4.0 BY-SA版权协议,转载请附上原文出处链接和本声明。