- 样例数据
ori_file = '1.nii.gz'
- 使用sampleITK读取数据,注意SimpleITK 加载数据是channel_first。
import SimpleITK as sitk
ds = sitk.ReadImage(file)
img_array = sitk.GetArrayFromImage(ds)
np.shape(img_array)
(229, 512, 512)
channel为229。
- 查看图像的原点Origin,大小Size,间距Spacing和方向Direction。
print(ds.GetOrigin())
print(ds.GetSize())
print(ds.GetSpacing())
print(ds.GetDirection())
(-249.51171875, -442.51171875, -610.5999755859375)
(512, 512, 229)
(0.9765625, 0.9765625, 2.0)
(1.0, 0.0, 0.0, 0.0, 1.0, 0.0, 0.0, 0.0,1.0)
- 查看图像相关的纬度信息
print(ds.GetDimension())
print(ds.GetWidth())
print(ds.GetHeight())
print(ds.GetDepth())
3
512
512
229
- 体素类型查询
print(ds.GetPixelIDValue())
print(ds.GetPixelIDTypeAsString())
print(ds.GetNumberOfComponentsPerPixel())
2
16-bit signed integer
1
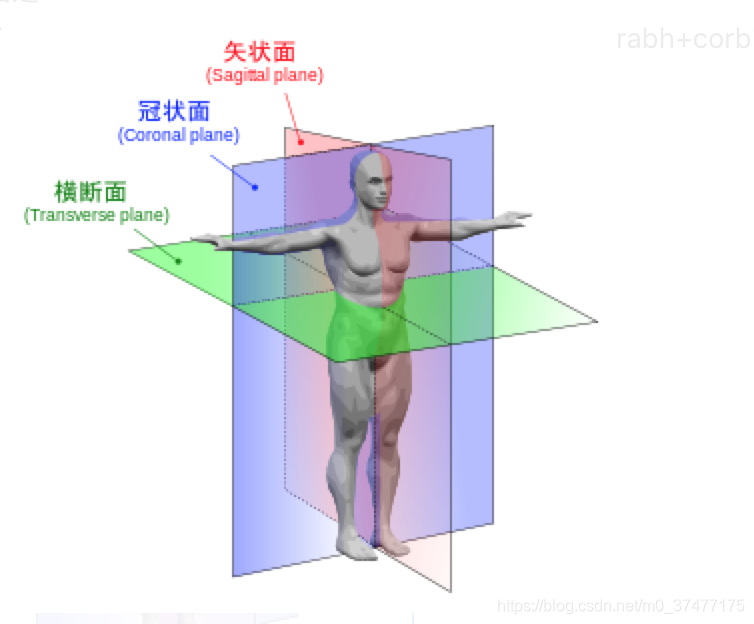
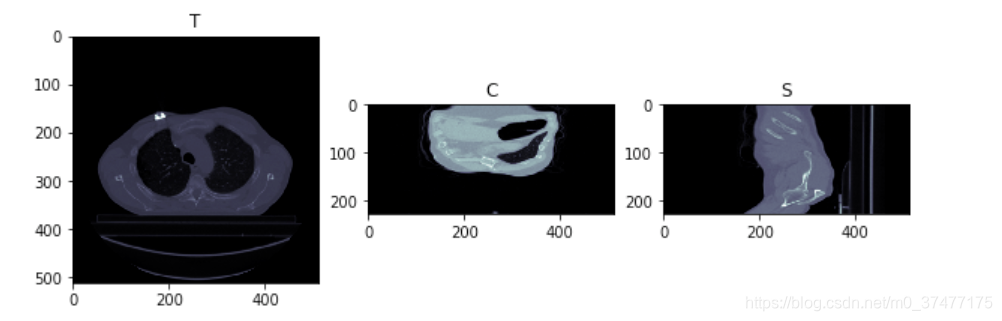
- 查看某一个横断面和冠状面
fig, (ax1, ax2, ax3) = plt.subplots(1, 3, figsize = (10, 5))
ax1.imshow(img_array[150,:,:], cmap=plt.cm.bone)
ax1.set_title('T')
ax2.imshow(img_array[:,150,:], cmap=plt.cm.bone)
ax2.set_title('C')
ax3.imshow(img_array[:,:,100], cmap=plt.cm.bone)
ax3.set_title('S')
7. Resampling
将s p a c e : ( 0.9765625 , 0.9765625 , 2.0 ) − − − > ( 1 , 1 , 1 ) space: (0.9765625, 0.9765625, 2.0) ---> (1, 1,1)space:(0.9765625,0.9765625,2.0)−−−>(1,1,1)
def ImageResample(sitk_image, new_spacing = [1.0, 1.0, 1.0], is_label = False):
    '''
    sitk_image:
    new_spacing: x,y,z
    is_label: if True, using Interpolator `sitk.sitkNearestNeighbor`
    '''
    size = np.array(sitk_image.GetSize())
    spacing = np.array(sitk_image.GetSpacing())
    new_spacing = np.array(new_spacing)
    new_size = size * spacing / new_spacing
    new_spacing_refine = size * spacing / new_size
    new_spacing_refine = [float(s) for s in new_spacing_refine]
    new_size = [int(s) for s in new_size]

    resample = sitk.ResampleImageFilter()
    resample.SetOutputDirection(sitk_image.GetDirection())
    resample.SetOutputOrigin(sitk_image.GetOrigin())
    resample.SetSize(new_size)
    resample.SetOutputSpacing(new_spacing_refine)

    if is_label:
        resample.SetInterpolator(sitk.sitkNearestNeighbor)
    else:
        #resample.SetInterpolator(sitk.sitkBSpline)
        resample.SetInterpolator(sitk.sitkLinear)

    newimage = resample.Execute(sitk_image)
    return newimage
nor = ImageResample(ds)
nor.GetSize()
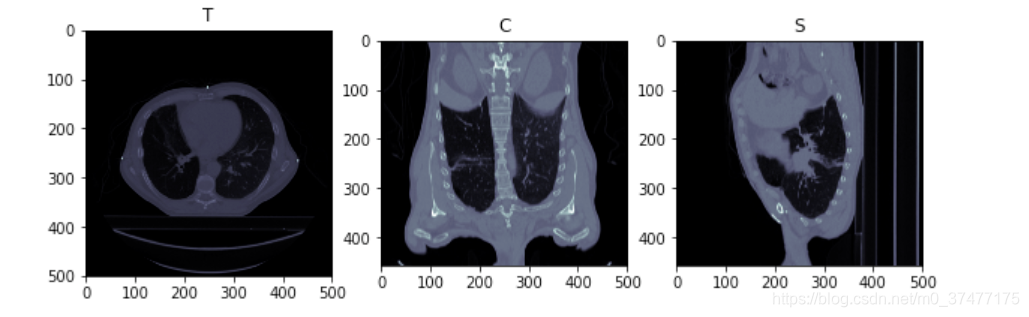
- 打印Resampling之后的图像
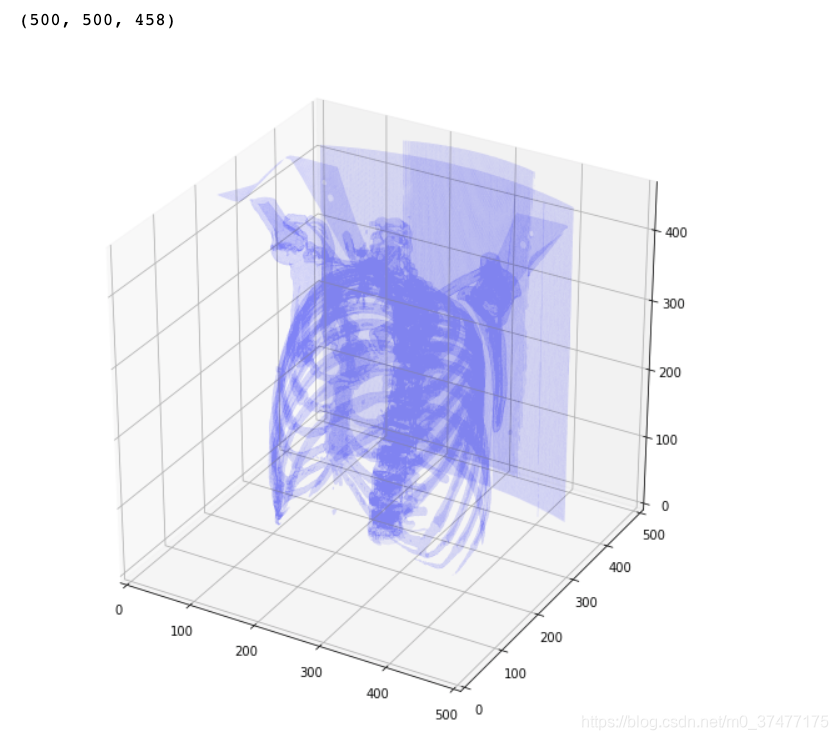
- 3D plot
import scipy.ndimage
import matplotlib.pyplot as plt

from skimage import measure, morphology
from mpl_toolkits.mplot3d.art3d import Poly3DCollection


def plot_3d(image, threshold=-300):

    # Position the scan upright,
    # so the head of the patient would be at the top facing the camera
    image = image.astype(np.int16)
    p = image.transpose(2,1,0)
#     p = p[:,:,::-1]

    print(p.shape)
    verts, faces, _, x = measure.marching_cubes_lewiner(p, threshold) #marching_cubes_classic measure.marching_cubes

    fig = plt.figure(figsize=(10, 10))
    ax = fig.add_subplot(111, projection='3d')

    # Fancy indexing: `verts[faces]` to generate a collection of triangles
    mesh = Poly3DCollection(verts[faces], alpha=0.1)
    face_color = [0.5, 0.5, 1]
    mesh.set_facecolor(face_color)
    ax.add_collection3d(mesh)

    ax.set_xlim(0, p.shape[0])
    ax.set_ylim(0, p.shape[1])
    ax.set_zlim(0, p.shape[2])

    plt.show()
plot_3d(nor_data, 100)
参考
版权声明:本文为m0_37477175原创文章,遵循CC 4.0 BY-SA版权协议,转载请附上原文出处链接和本声明。