

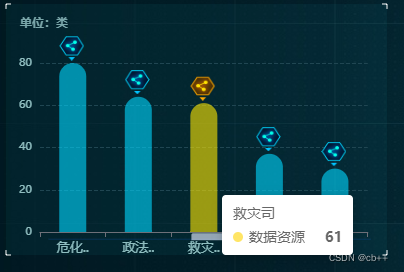
重点:
- 柱状图顶端放置图片
- 柱状图循环滚动
- 触发滚动停止,柱子变色图片更改,离开继续滚动
上代码
import React from "react";
import * as echarts from "echarts";
import styles from "./index.less";
import cylinderImg from "../../assets/images/serviceAssets/IconLeftMiddle.png";
import { getDataResourceServiceBnsjhjpm } from "../../services/yj";

class CylinderDiagram extends React.Component {
  state = {
    dataResource: [],
  };
  loadCylinder = () => {
    const { dataResource } = this.state;
    var cylinderChart = echarts.init(document.getElementById("cylinder"));
    var option;
    var img = new Image();
    img.src = { cylinderImg };
    let imgSrc1 = require("../../assets/images/serviceAssets/IconLeftMiddle2.png");
    let imgSrc2 = require("../../assets/images/serviceAssets/IconLeftMiddle.png");
    const seriesLabel = {
      show: false,
      color: "pink",
    };
    let timer = null;

    cylinderChart.clear();
    clearInterval(timer);
    let seriesData = dataResource.map((i) => {
      return i.dataindex;
    });
    let xAxisData = dataResource.map((i) => {
      return i.dataitem;
    });
    let markPointDatum = [];
    for (var i = 0; i < seriesData.length; i++) {
      let _obj = {
        coord: [i, seriesData[i]],
        value: seriesData[i],
      };
      markPointDatum.push(_obj);
    }
    option = {
      title: {
        text: "单位:类",
        textStyle: {
          fontSize: 12,
          fontFamily: "PingFangSC-Regular",
          color: "#7ba7aa",
        },
        left: 10,
        top: 10,
      },
      tooltip: {
        trigger: "axis",
        axisPointer: {
          type: "none",
        },
      },
      grid: {
        left: 35,
      },
      toolbox: {
        show: false,
        feature: {
          saveAsImage: {},
        },
      },
      yAxis: {
        splitLine: {
          show: true,
          lineStyle: {
            type: "dashed",
            color: "#204652",
          },
        },
        type: "value",
        axisLabel: {
          formatter: "{value}",
          textStyle: {
            color: "rgba(204,255,254,0.70)", // 更改坐标轴文字颜色
            fontSize: 11, // 更改坐标轴文字大小
          },
        },
      },
      xAxis: {
        type: "category",
        inverse: false,
        data: xAxisData,
        axisLabel: {
          formatter: function (value) {
            if (value.length > 2) {
              return value.substring(0, 2) + "..";
            } else {
              return value;
            }
          },
          margin: 10,
          textStyle: {
            color: "rgba(204,255,254,0.70)", // 更改坐标轴文字颜色
            fontSize: 13, // 更改坐标轴文字大小
          },
        },
      },
      series: [
        {
          name: "数据资源",
          type: "bar",
          data: seriesData,
          label: seriesLabel,
          color: "rgba(0,215,255,0.60)",
          barWidth: "27px",

          markPoint: {
            symbol: "image://" + imgSrc1,
            symbolSize: 25,
            symbolOffset: [-1, -15],
            label: {
              formatter: "  ",
              borderWidth: 1,
              borderRadius: 4,
              padding: [10, 10],
              position: "right",
              distance: 0,
            },
            // data: [{ type: 'max' }],
            data: markPointDatum,
          },
          itemStyle: {
            barBorderRadius: [50, 50, 0, 0],
          },
        },
      ],
      // 自动滚动

      // dataZoom: [
      //   //滑动条
      //   {
      //     show: true, //是否显示滑动条
      //     type: "slider", // 这个 dataZoom 组件是 slider 型 dataZoom 组件
      //     startValue: 0, // 从头开始。
      //     endValue: 4, // 一次性展示5个。
      //   },
      // ],
      dataZoom: [
        {
          type: "inside",
          startValue: 0,
          endValue: 4,
          minValueSpan: 4,
          maxValueSpan: 4,
          xAxisIndex: [0],
          zoomOnMouseWheel: false, // 关闭滚轮缩放
          moveOnMouseWheel: true, // 开启滚轮平移
          moveOnMouseMove: true, // 鼠标移动能触发数据窗口平移
        },
        {
          type: "slider",
          realtime: true,
          startValue: 0,
          endValue: 4,
          width: "80%",
          height: 0,
          xAxisIndex: [0], // 控制x轴滚动
          fillerColor: "rgba(154, 181, 215, 1)", // 滚动条颜色
          borderColor: "rgba(17, 100, 210, 0.12)",
          backgroundColor: "#cfcfcf", //两边未选中的滑动条区域的颜色
          handleSize: 0, // 两边手柄尺寸
          showDataShadow: false, //是否显示数据阴影 默认auto
          showDetail: false, // 拖拽时是否展示滚动条两侧的文字
          bottom: "23%",
        },
      ],
    };
    option && cylinderChart.setOption(option);
    // 使用刚指定的配置项和数据显示图表。
    timer = setInterval(function () {
      // 每次向后滚动一个,最后一个从头开始。
      if (option.dataZoom[0].endValue == seriesData.length - 1) {
        option.dataZoom[0].endValue = 4;
        option.dataZoom[0].startValue = 0;
      } else {
        option.dataZoom[0].endValue = option.dataZoom[0].endValue + 1;
        option.dataZoom[0].startValue = option.dataZoom[0].startValue + 1;
      }
      // cylinderChart.clear();
      cylinderChart.setOption(option, true);
    }, 2000);

    cylinderChart.on("mouseover", function (event) {
      clearInterval(timer);
      option.series[0].itemStyle.color = function (value, index) {
        return value.dataIndex === event.dataIndex
          ? "rgba(255,211,0,0.60)"
          : "rgba(0,215,255,0.60)";
      };
      option.series[0].markPoint.symbol = function (value, index) {
        return value === event.data
          ? "image://" + imgSrc2
          : "image://" + imgSrc1;
      };
      cylinderChart.setOption(option);
    });
    cylinderChart.on("mouseout", function (event) {
      option.series[0].itemStyle.color = "rgba(0,215,255,0.60)";
      option.series[0].markPoint.symbol = "image://" + imgSrc1;
      // option.series[0].markPoint.label.backgroundColor.image = imgSrc1;
      timer = setInterval(function () {
        // 每次向后滚动一个,最后一个从头开始。
        if (option.dataZoom[0].endValue == seriesData.length - 1) {
          option.dataZoom[0].endValue = 4;
          option.dataZoom[0].startValue = 0;
        } else {
          option.dataZoom[0].endValue = option.dataZoom[0].endValue + 1;
          option.dataZoom[0].startValue = option.dataZoom[0].startValue + 1;
        }
        // cylinderChart.clear();
        cylinderChart.setOption(option, true);
      }, 2000);
      cylinderChart.setOption(option, true);
    });
  };
  getDataResourceServiceBnsjhjpm = async () => {
    try {
      const res = await getDataResourceServiceBnsjhjpm();
      this.setState({ dataResource: res.data }, () => {
        this.loadCylinder();
      });
    } catch (error) {
      console.log(error);
    }
  };
  componentDidMount() {
    this.getDataResourceServiceBnsjhjpm();
  }
  render() {
    return (
      <div
        style={{ width: "100%", height: "118%" }}
        id="cylinder"
        className={styles.cylinder}
      ></div>
    );
  }
}
export default CylinderDiagram;
版权声明:本文为weixin_44768794原创文章,遵循CC 4.0 BY-SA版权协议,转载请附上原文出处链接和本声明。