echarts饼图 配置,及案例
案例(1):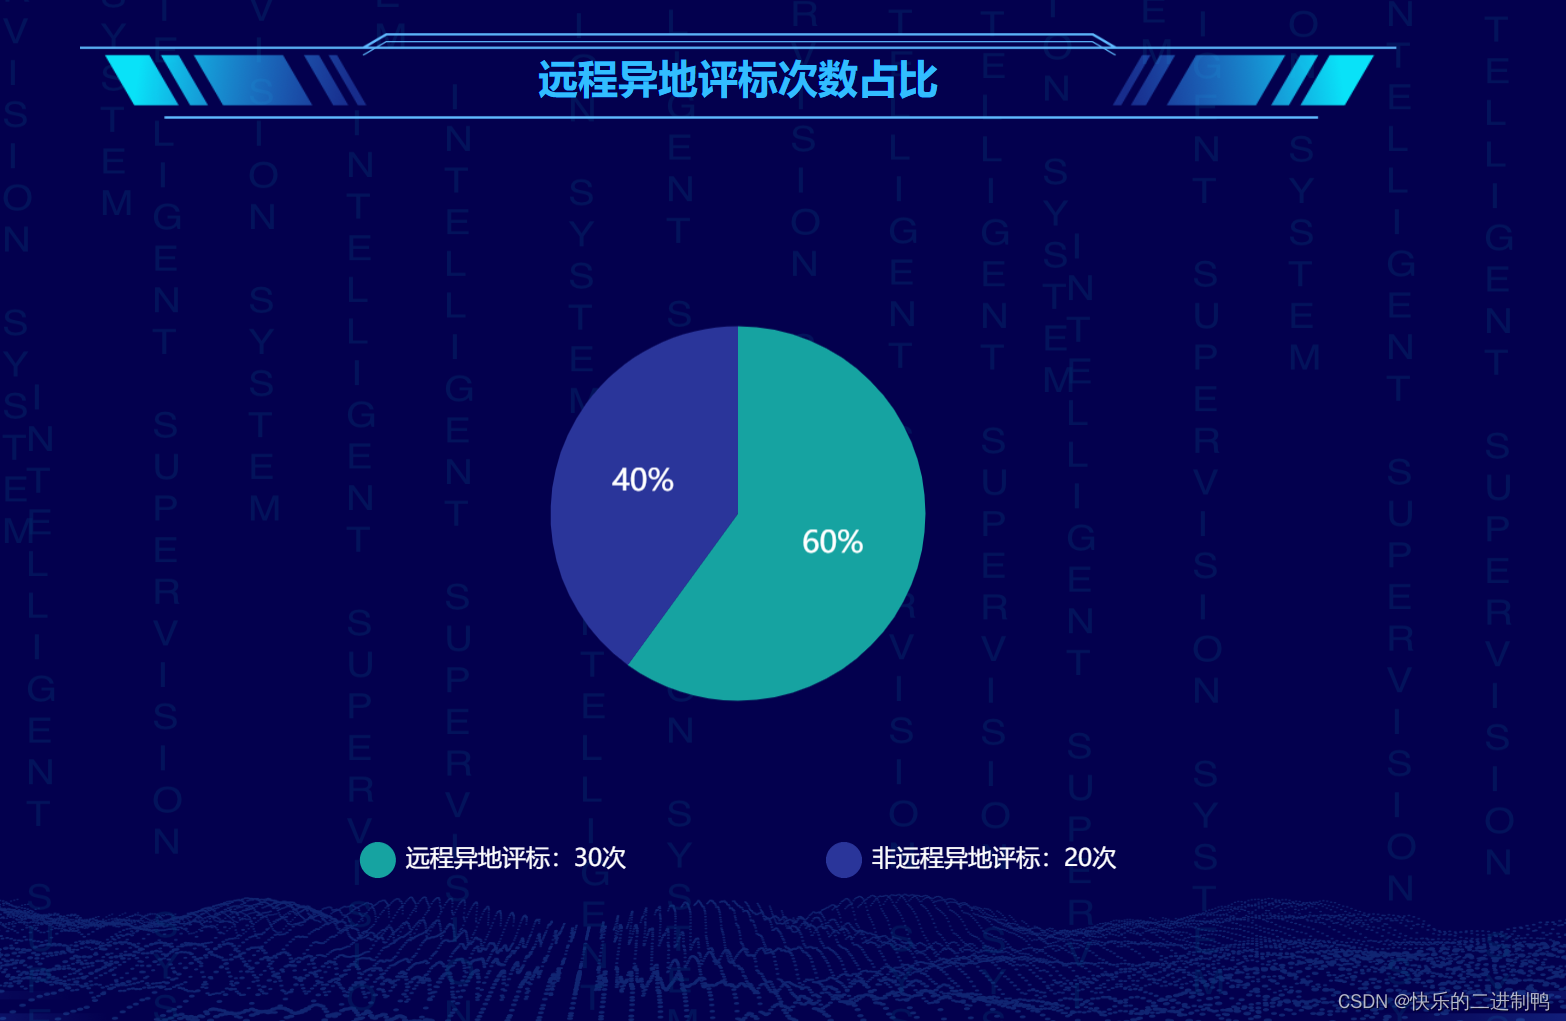
let option = {
                tooltip: {  //提示框
                    trigger: 'axis',
                    formatter: '{a} <br/>{b}: {c} ({d}%)'
                },
                y: 'bottom',
                legend: { //对图例进行配置
                    y: 'bottom',
                    x: 'center',
                    orient: 'horizontal', //图例设置布局方式  水平    垂直为vertical
                    itemHeight: 18,
                    itemWidth: 18, //图例宽
                    icon: "circle", //图例设为圆形
                    textStyle: {  //图例文字颜色
                        color: '#fff'
                    },
                    itemGap: 100,  //图例之间的间隔
                    data: ['远程异地评标','非远程异地评标']
                    // data: this.tradeByTypeList.map(function (e) { return e.projectTypeName }),
                },
                series: [
                {
                    type: 'pie',  //饼图
                    selectedMode: 'single',
                    radius: [0, '50%'],
                    label: {
                        show: true,
                        position: 'inner',
                        fontSize: 15,
                        color: '#fff',
                        formatter: "{d}%"
                    },
                    labelLine: {  //设置值域的指向线
                        show: false  //隐藏
                    },
                    data: [
                        { value: 30, name: '远程异地评标' },
                        { value: 20, name: '非远程异地评标' }
                    ],
                    color: ['rgba(22,163,161,1)', '#2A359A'],
                    width: '100%',
                },
                ],
                formatter: function(name) {
                    let data = option.series[0].data;
                    let total = 0;
                    let tarValue;
                    for (let i = 0; i < data.length; i++) {
                        total += data[i].value;
                        if (data[i].name === name) {
                        tarValue = data[i].value;
                        }
                    }
                    // 数量
                    let v = tarValue;
                    // 百分比
                    let p = Math.round(((tarValue / total) * 100));
                    return `${name}:${v}次`;
                    },
            };
案例(2):带有嵌套的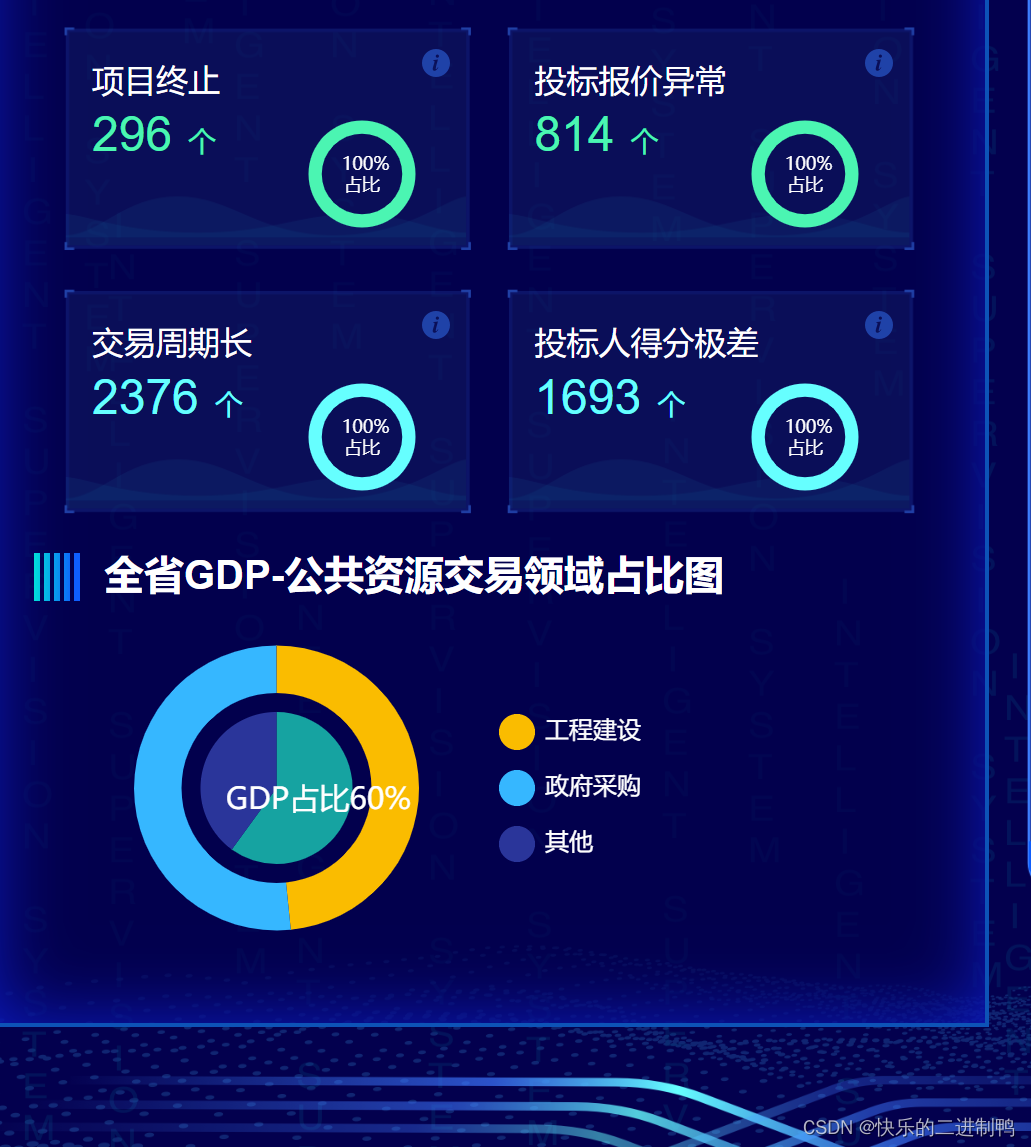
let option = {
        tooltip: {
          trigger: '',
          formatter: '{a} <br/>{b}: {c} ({d}%)'
        },
        // {'工程建设占比',
        //     '政府采购占比',}
        y: 'bottom',
        legend: { //对图例进行配置
          data: this.tradeByTypeList.map(function (e) { return e.projectTypeName }),
          y: 'center',
          x: '50%',
          orient: 'right', //图例位置
          itemHeight: 18,
          itemWidth: 18, //图例宽
          icon: "circle", //图例设为圆形
          textStyle: {  //图例文字颜色
            color: '#fff'
          }
        },
        series: [
          {
            type: 'pie',
            selectedMode: 'single',
            radius: [0, '40%'],
            label: {
              position: 'inner',
              fontSize: 15,
              color: '#fff'
            },
            labelLine: {
              show: false
            },
            data: [
              { value: 0.6, name: 'GDP占比60%' },
              { value: 0.4, name: '' }
            ],
            color: ['rgba(22,163,161,1)', '#2A359A'],
            width: '50%',
          },
          {
            type: 'pie',
            radius: ['50%', '75%'],
            labelLine: {
              show: false
            },
            label: false,
            width: '50%',
            data: this.tradeByTypeList.map(function (e) {
              return {
                name: e.projectTypeName,
                value: e.tradeTypeNums
              }
            }),
            color: ['#FABC00', '#36B7FF', '#2A359A']
          }
        ]
      };
版权声明:本文为qq_41973526原创文章,遵循CC 4.0 BY-SA版权协议,转载请附上原文出处链接和本声明。