机器学习训练营——机器学习爱好者的自由交流空间(入群联系qq:2279055353)
案例介绍
颅内出血(Intracranial Hemorrhage, ICH),是一个严重的健康问题,需要快速而紧急的医疗处置。在美国,中风是第五大致死疾病,而大约有10%的中风患者伴有颅内出血。在治疗颅内出血时,识别出血类型与位置是关键的一步。当患者表现出急性神经症状时,例如,严重的头痛、意识丧失等,训练有素的医生通过审查患者颅内的医学影像,判断出血类型、位置和状态。这个过程非常复杂且很费时。
本案例的颅内图像数据集由RSNA(北美放射学会)提供,任务是开发一个机器学习算法,识别急性颅内出血及其亚型。该案例的解决方案可以应用于快速准确地识别颅内出血患者的出血位置、类型及出血状态。
数据描述
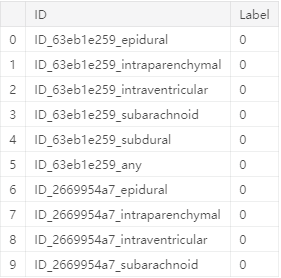
训练数据由颅内出血图像集组成,每个图像数据有Id, 出血亚型标签,还有一个any, 表示是否存在亚型标签。有4种类型的颅内出血:
硬膜外出血(epidural hematoma)
硬膜下出血(subdural hematoma)
蛛网膜下出血(subarachnoid hemorrhage)
脑内出血(intracerebral hemorrhage)
target 列,Label, 表示出血类型存在于当前图像里的概率。我们要预测给定的图像是否存在颅内出血,是哪种类型?
数据探索
加载库
import glob, pylab, pandas as pd
import pydicom, numpy as np
from os import listdir
from os.path import isfile, join
import matplotlib.pylab as plt
import os
import seaborn as sns
from keras import layers
from keras.applications import DenseNet121
from keras.preprocessing.image import ImageDataGenerator
from keras.callbacks import Callback, ModelCheckpoint
from keras.preprocessing.image import ImageDataGenerator
from keras.models import Sequential
from keras.optimizers import Adam
from tqdm import tqdm
导入数据
train = pd.read_csv('../input/rsna-intracranial-hemorrhage-detection/stage_1_train.csv')
train.shape
train.head(10)
(4045572, 2)
检查Label是否有缺失值。
newtable = train.copy()
train.Label.isnull().sum()
0
显示数据文件的大小。
print('Total File sizes:')
for f in os.listdir('../input/rsna-intracranial-hemorrhage-detection'):
    if 'zip' not in f:
        print(f.ljust(30) + str(round(os.path.getsize('../input/rsna-intracranial-hemorrhage-detection/' + f) / 1000000, 2)) + 'MB')
Total File sizes:
stage_1_sample_submission.csv 13.43MB
stage_1_train.csv 107.21MB
stage_1_test_images 2.71MB
stage_1_train_images 23.41MB
print('Number of train images:', len(train_images))
print('Number of test images:', len(test_images))
Number of train images: 674258
Number of test images: 78545
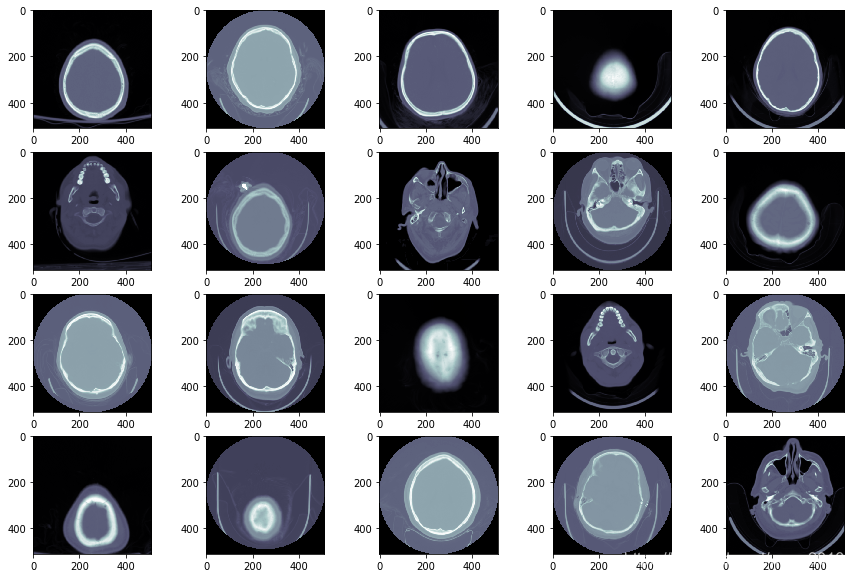
检查图像
医学图像存储在DICOM文件里(*.dcm)。它包括处于文件头的元数据(metadata), 用像素数据表示的原始图像。在Python里,使用pydicom模块访问和操作DICOM文件。首先,将
patientId与DICOM文件匹配。然后,使用pydicom.read_file()方法加载数据。
fig=plt.figure(figsize=(15, 10))
columns = 5; rows = 4
for i in range(1, columns*rows +1):
    ds = pydicom.dcmread(train_images_dir + train_images[i])
    fig.add_subplot(rows, columns, i)
    plt.imshow(ds.pixel_array, cmap=plt.cm.bone)
    fig.add_subplot
可视化数据
sns.countplot(train.Label)
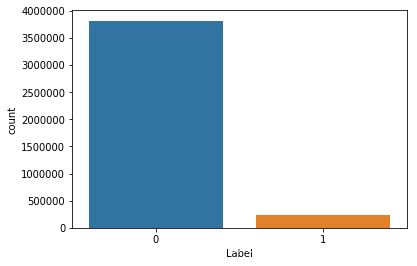
train.Label.value_counts()
0 3814760
1 230812
Name: Label, dtype: int64
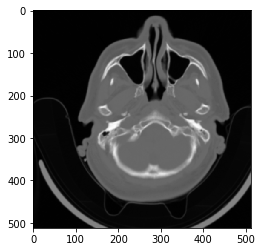
第一张DICOM图像
pylab.imshow(im, cmap=pylab.cm.gist_gray)
pylab.axis('on')
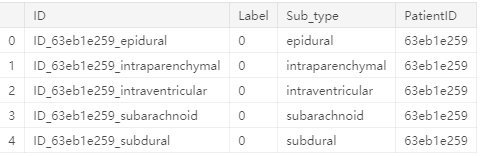
从ID拆分出亚型与患者ID变量。
train['Sub_type'] = train['ID'].str.split("_", n = 3, expand = True)[2]
train['PatientID'] = train['ID'].str.split("_", n = 3, expand = True)[1]
train.head()
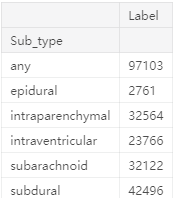
gbSub = train.groupby('Sub_type').sum()
gbSub
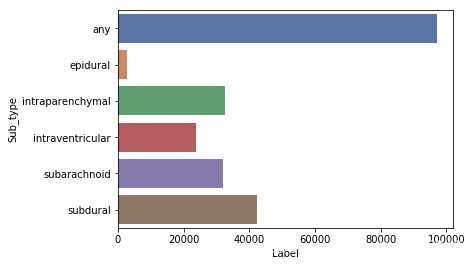
sns.barplot(y=gbSub.index, x=gbSub.Label, palette="deep")
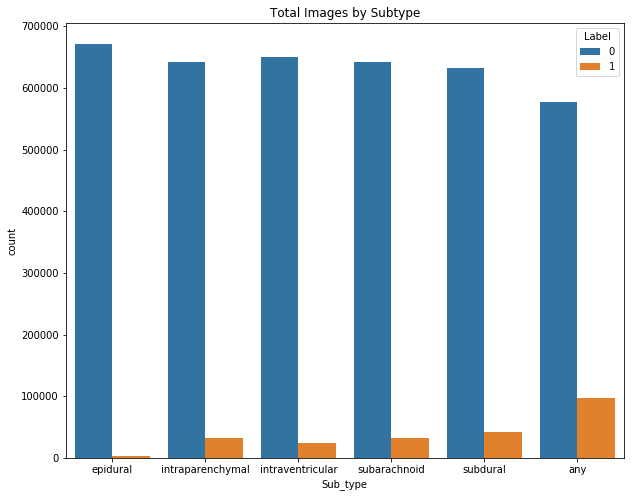
fig=plt.figure(figsize=(10, 8))

sns.countplot(x="Sub_type", hue="Label", data=train)

plt.title("Total Images by Subtype")
阅读更多精彩内容请关注微信公众号“统计学习与大数据”