前言
利用IRIS数据集,基于pytorch,练习构建简单的ANN网络
(又名:放假了把作业整理一下,复习一遍课程
Task
学习用pytorch搭建ANN模型
Dataset
IRIS
1.导入包和数据
from sklearn import datasets
import numpy as np
import seaborn as sns
import matplotlib.pyplot as plt
import pandas as pd
url = "https://raw.githubusercontent.com/callxpert/datasets/master/iris.data.txt"
names = ['sepal-length', 'sepal-width', 'petal-length', 'petal-width', 'class']
dataset = pd.read_csv(url, names=names)
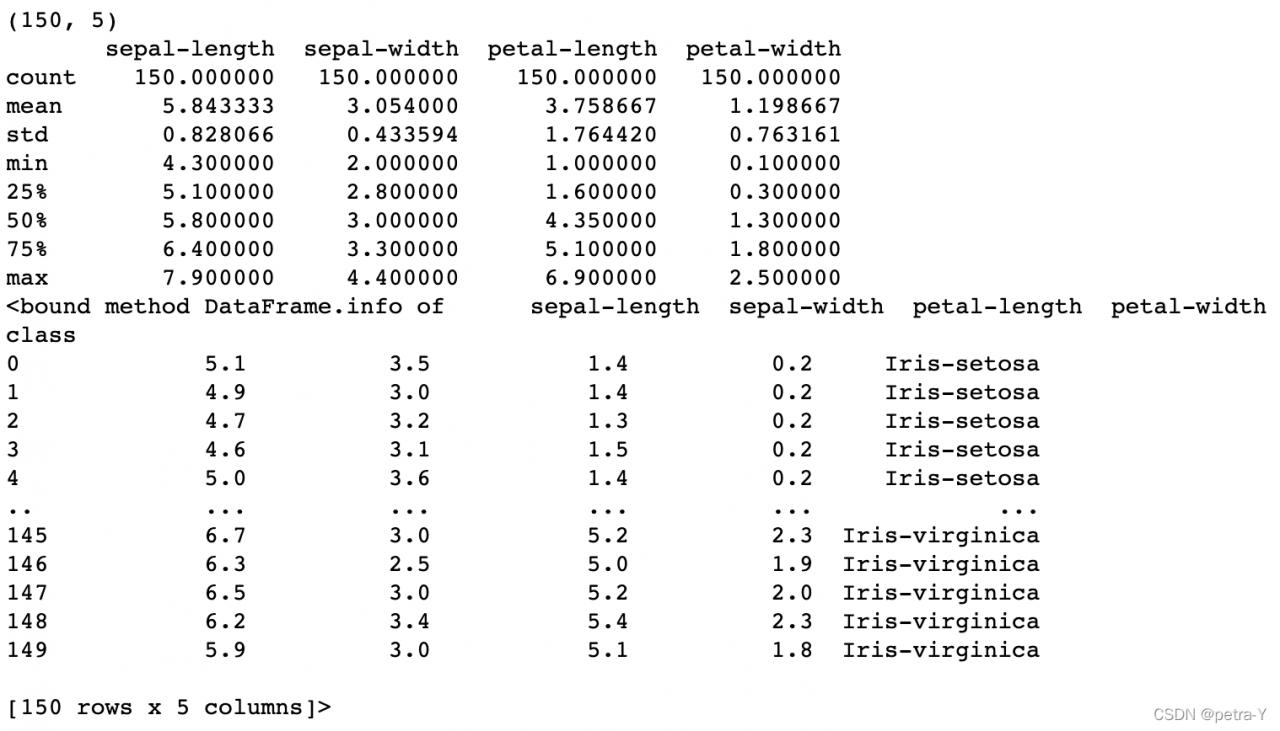
2.Exploratory Data Analysis (EDA)数据探索
# shape
print(dataset.shape)
#Find out the statistical summary of the data
#including the count, mean, the min and max values as well as some percentiles.
print(dataset.describe())
print(dataset.info)
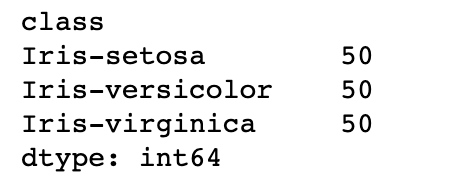
#class distribution
print(dataset.groupby('class').size())
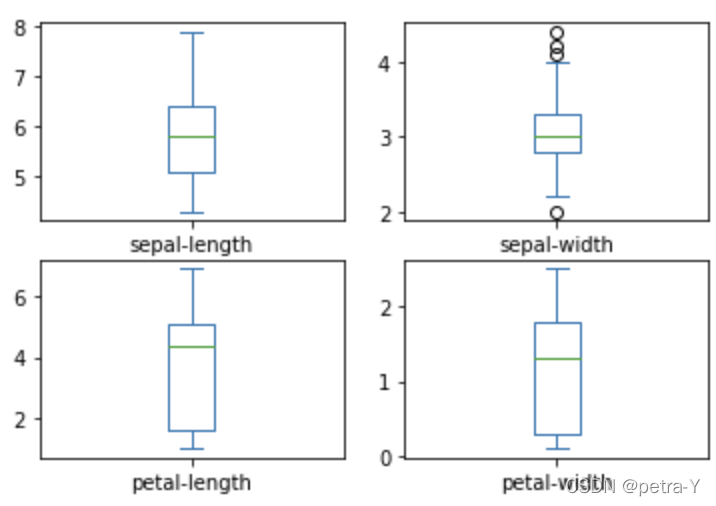
# box and whisker plots
dataset.plot(kind='box', subplots=True, layout=(2,2), sharex=False, sharey=False)
plt.show()
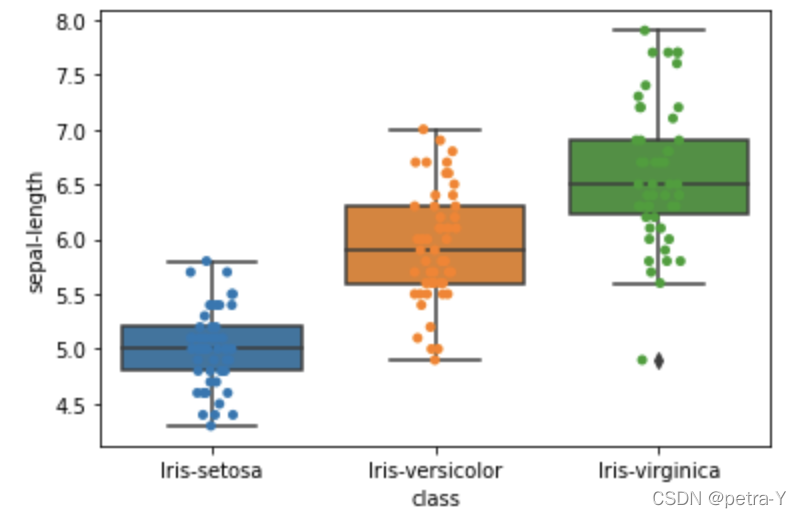
ax = sns.boxplot(x="class", y="sepal-length", data=dataset)
ax = sns.stripplot(x="class", y="sepal-length", data=dataset, jitter=True, edgecolor="gray")
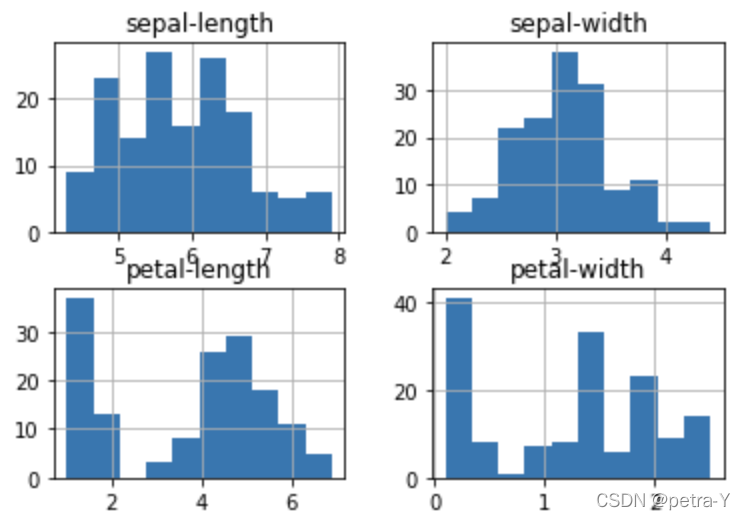
# histograms
dataset.hist()
plt.show()
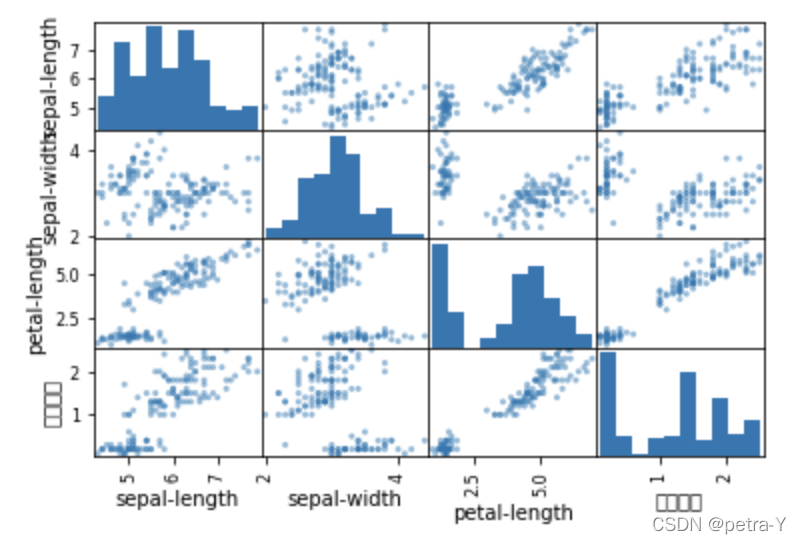
#build a scatter plot which shows us the correlation with respect to other features.
## scatter plot matrix
from pandas.plotting import scatter_matrix
scatter_matrix(dataset)
plt.show()
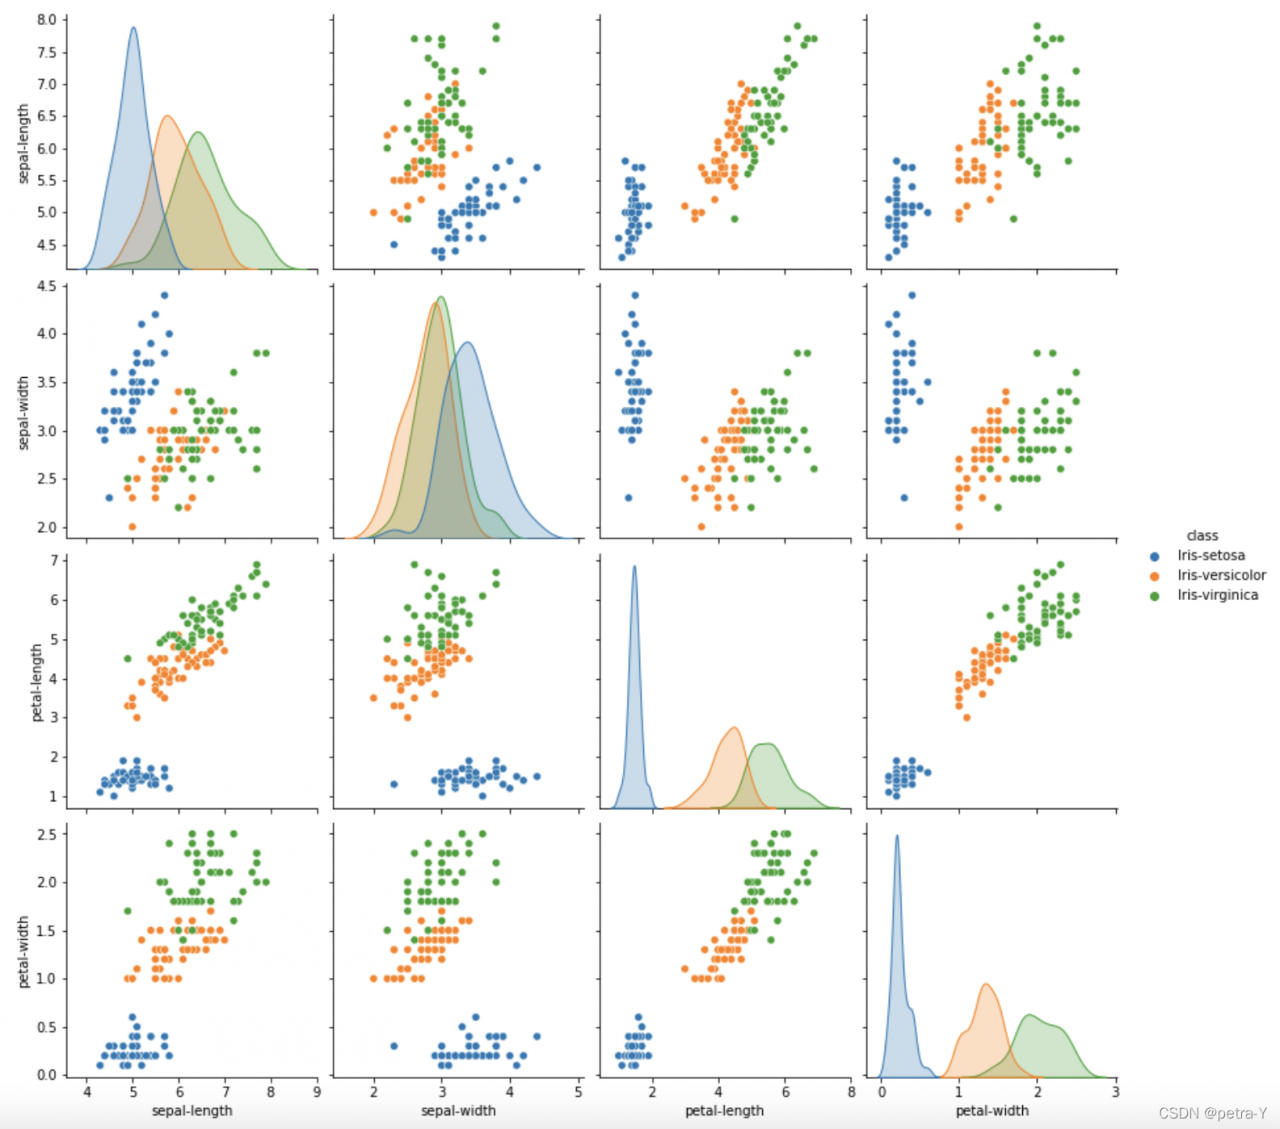
sns.pairplot(dataset, hue="class", size=3)
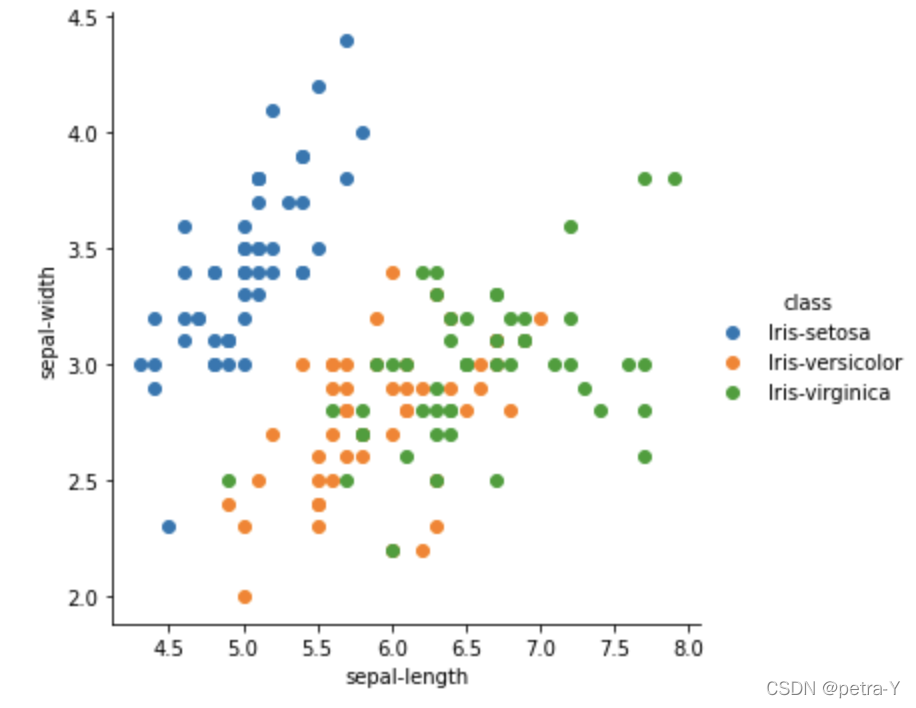
#Scatter plot of sepal-length and sepal-width features
sns.FacetGrid(dataset, hue="class", size=5) \
   .map(plt.scatter, "sepal-length", "sepal-width") \
   .add_legend()
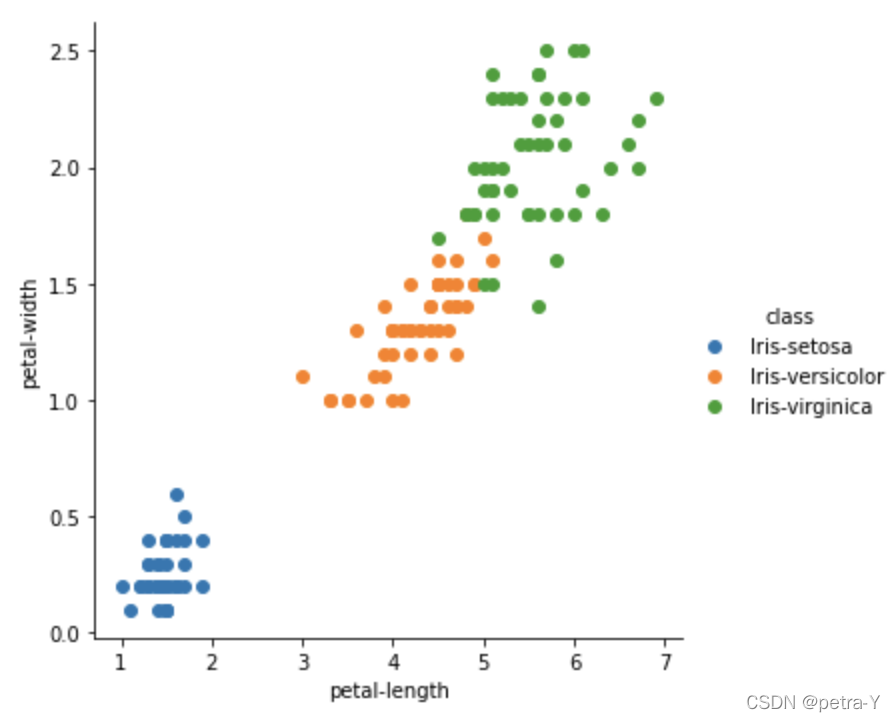
#Scatter plot of petal-length and petal-width features
sns.FacetGrid(dataset, hue="class", size=5) \
   .map(plt.scatter, "petal-length", "petal-width") \
   .add_legend()
3.划分数据集
from sklearn.model_selection import train_test_split
array = dataset.values
X = array[:,0:4]
Y = array[:,4]
x_train, x_test, y_train, y_test = train_test_split(X,Y, test_size=0.3, random_state=7)
4.KNN
KNN与k-means(待补)
#Build the model
from sklearn import neighbors
classifier=neighbors.KNeighborsClassifier()
#Train the Model
classifier.fit(x_train,y_train)
#Make predictions
predictions=classifier.predict(x_test)
#the accuracy
from sklearn.metrics import accuracy_score
acc = accuracy_score(y_test, predictions)
print(accuracy_score(y_test, predictions))
#Classification Report
from sklearn.metrics import classification_report
print(classification_report(y_test, predictions))
5.ANN
#we bulid model by pytorch
import torch.nn as nn
import torch.nn.functional as F
class Model(nn.Module):
    def __init__(self):
        super(Model, self).__init__()
        n_feature=4
        n_hidden=30
        n_output=3
        self.model = nn.Sequential(
                    nn.Linear(n_feature, n_hidden),#
                    nn.ReLU(),
                    nn.Linear(n_hidden, n_hidden),
                    nn.ReLU(),
                    nn.Linear(n_hidden, n_output))
    def forward(self, x):
        out = self.model(x)
        y_pred = F.softmax(out, dim=1)
        return y_pred
model = Model()
print(model)
设定参数和loss function
import torch
optimizer = torch.optim.SGD(model.parameters(), lr=0.001)
loss_func = nn.CrossEntropyLoss()
训练
#Numerical coding y_train and y_test
from sklearn.preprocessing import LabelEncoder
y_train = LabelEncoder().fit_transform(y_train)
y_test = LabelEncoder().fit_transform(y_test)
#training and testing of dataset

for epoch in range(50000):
    train_loss = 0
    train_acc = 0
    model.train()
    #Forward
    out = model(torch.tensor(x_train.astype(float)).float())
    loss = loss_func(out, torch.tensor(y_train.astype(float)).long())
    #back
    optimizer.zero_grad()
    loss.backward()
    optimizer.step()
    if epoch%2000==0:
        print(epoch, loss.item())
    train_loss += loss.item()
结果
#training accuracy
model.eval()
#out = model(img)
#loss = criterion(out, label)
eval_loss = 0
eval_acc = 0
out = model(torch.tensor(x_test.astype(float)).float())
loss = loss_func(out, torch.tensor(y_test.astype(float)).long())
label = torch.tensor(y_test.astype(float)).long()
eval_loss += loss.data.item()*label.size(0)
_, pred = torch.max(out, 1) # 取最高概率的标签为预测值
num_correct = (pred == label).sum() # 计算预测正确的标签数
eval_acc += num_correct.item() # 计算正确率
测试
testloss = eval_loss / (len(y_test))
acc=eval_acc / (len(y_test))
print('Test Loss: {:.12f}, Acc: {:.12f}'.format(testloss,acc))
版权声明:本文为weixin_49221232原创文章,遵循CC 4.0 BY-SA版权协议,转载请附上原文出处链接和本声明。