Python+OpenCV:二维直方图(2D Histograms)
####################################################################################################
# 图像二维直方图(Image 2D Histograms)
def lmc_cv_image_2d_histograms():
    """
        函数功能: 图像二维直方图(Image 2D Histograms)。
    """

    images = []
    hists = []
    # 图像二维直方图(Image 2D Histograms)
    image_file_name = ['D:/99-Research/Python/Image/Rock.jpg', 'D:/99-Research/Python/Image/Lena.jpg']
    for i in range(len(image_file_name)):
        # 读取图像
        image = lmc_cv.imread(image_file_name[i])
        image = lmc_cv.cvtColor(image, lmc_cv.COLOR_BGR2RGB)
        hsv_image = lmc_cv.cvtColor(image, lmc_cv.COLOR_RGB2HSV)
        hist = lmc_cv.calcHist([hsv_image], [0, 1], None, [180, 256], [0, 180, 0, 256])
        images.append(image)
        hists.append(hist)

    # 显示图像
    pyplot.figure('Image Display: 2D Histograms')
    for i in range(len(images)):
        pyplot.subplot(2, 2, i * 2 + 1)
        pyplot.imshow(images[i], cmap='gray')
        pyplot.title('Original Image')
        pyplot.xticks([])
        pyplot.yticks([])
        pyplot.subplot(2, 2, i * 2 + 2)
        pyplot.imshow(hists[i], cmap='brg', interpolation='nearest')
        pyplot.title('2D Histogram')
    pyplot.show()

    # 根据用户输入保存图像
    if ord("q") == (lmc_cv.waitKey(0) & 0xFF):
        # 销毁窗口
        pyplot.close()
    return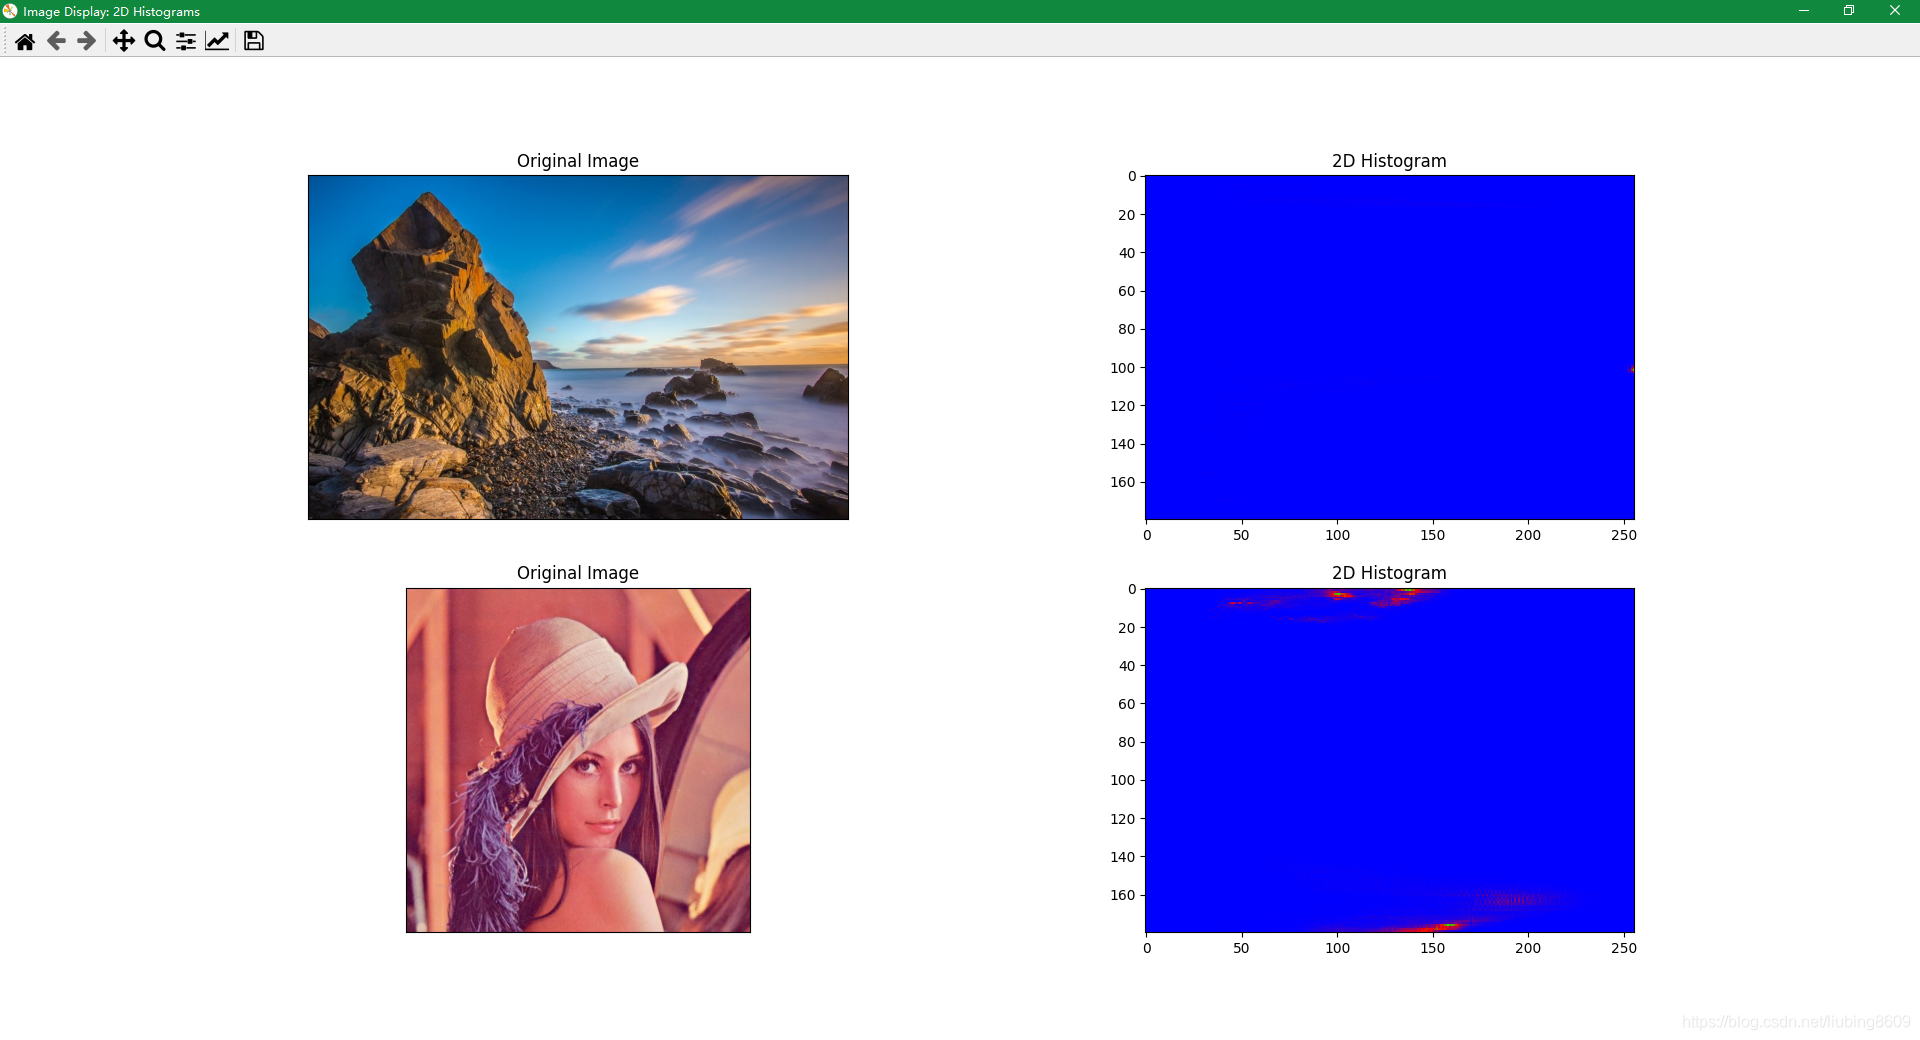
版权声明:本文为liubing8609原创文章,遵循CC 4.0 BY-SA版权协议,转载请附上原文出处链接和本声明。