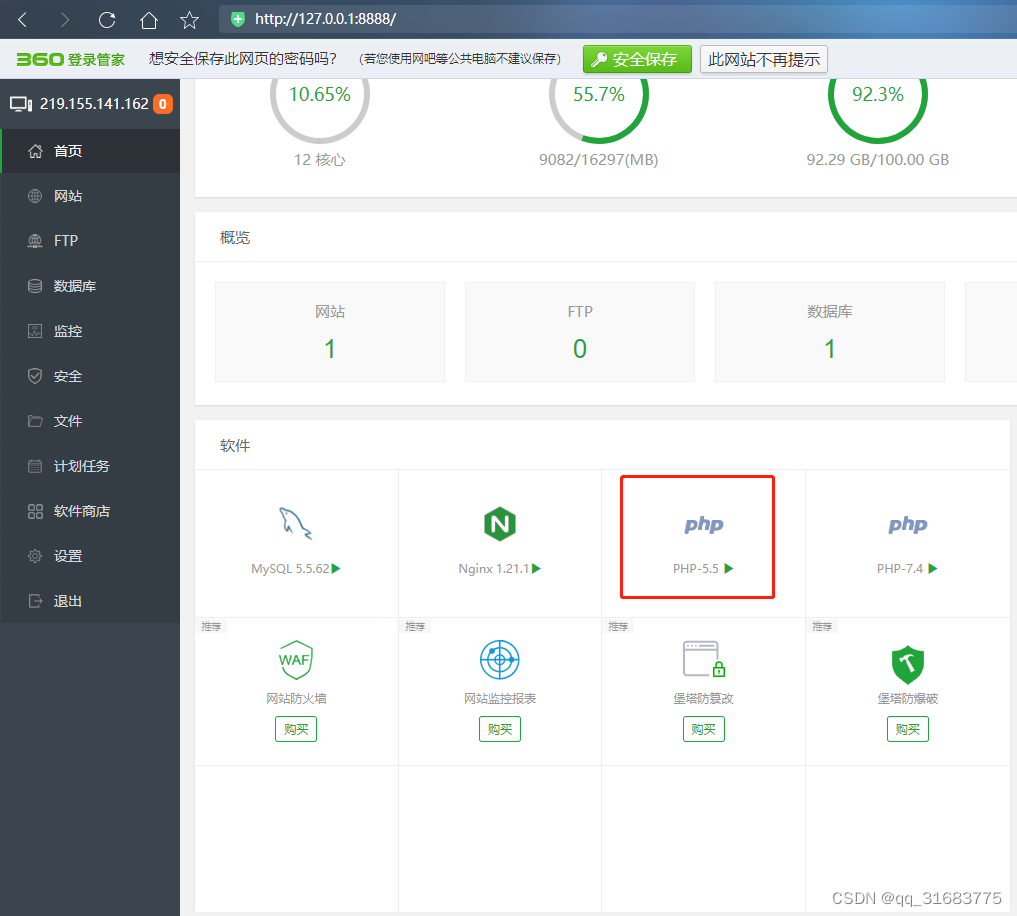
安装宝塔
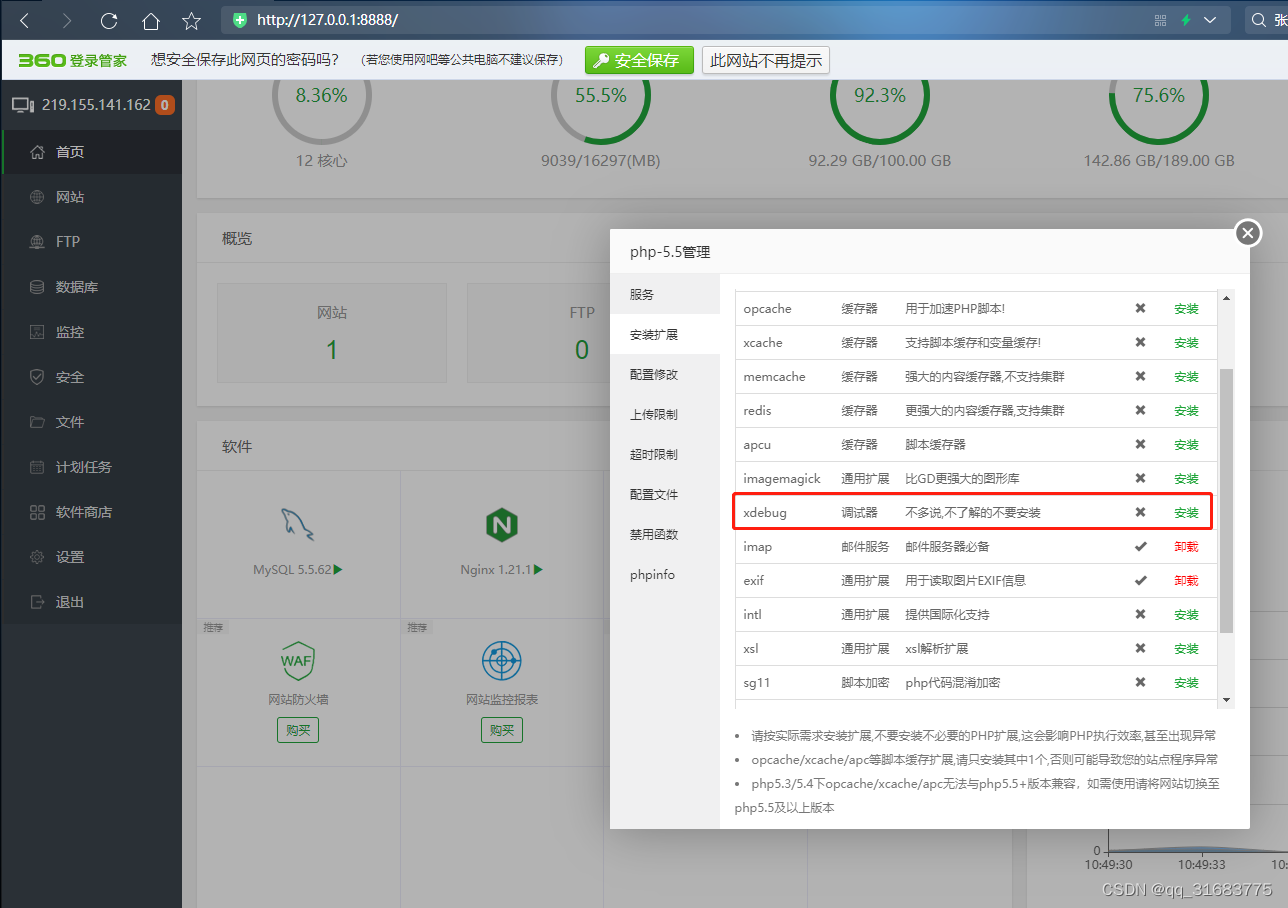
安装php xdebug插件
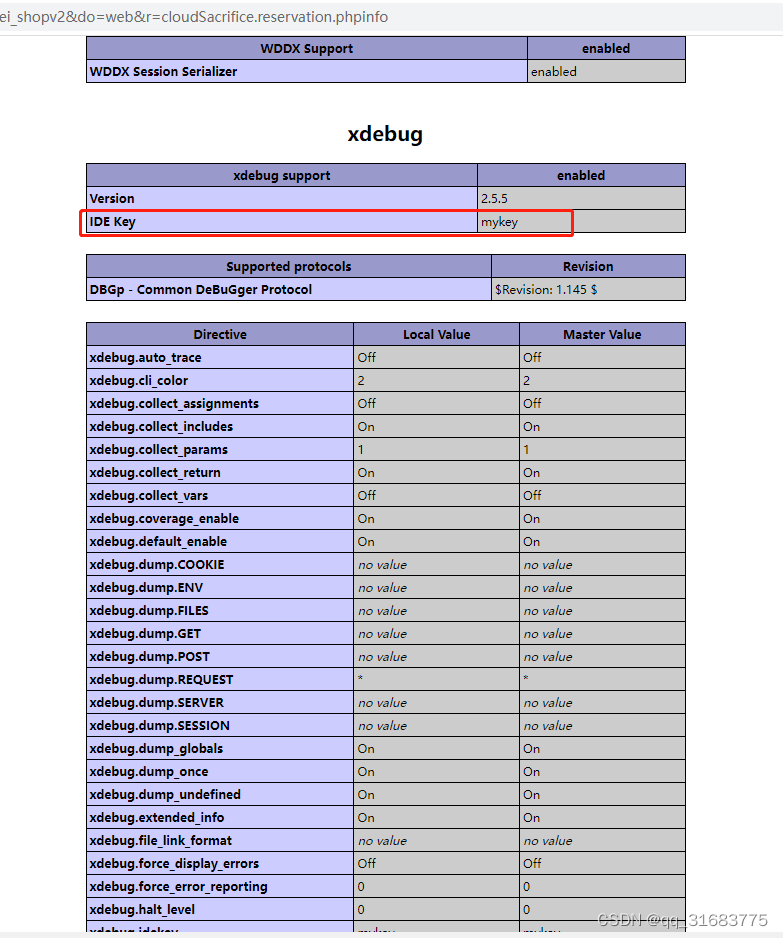
查看是否安装成功 phpinfo
修改php.ini 配置
[XDebug]
;xdebug.profiler_append = 0
;xdebug.profiler_enable = 1
;xdebug.profiler_enable_trigger = 0
;xdebug.profiler_output_dir ="D:\BtSoft\temp\xdebug"
;xdebug.trace_output_dir ="D:\BtSoft\temp\xdebug"
;xdebug.profiler_output_name = "cache.out.%t-%s"
;xdebug.remote_enable = 1
;xdebug.remote_handler = "dbgp"
;xdebug.remote_host = "127.0.0.1"
;zend_extension=php_xdebug.dll

zend_extension=php_xdebug.dll

;用来显示错误信息
display_errors = On
html_errors = On

;显示堆栈信息
xdebug.show_local_vars = 1
xdebug.max_nesting_level = 50
xdebug.var_display_max_depth = 6
xdebug.dump_once = On
xdebug.dump_globals = On
xdebug.dump_undefined = On
xdebug.dump.REQUEST = *
xdebug.cli_color = 2


;显示性能信息
xdebug.profiler_enable_trigger = on
xdebug.collect_params = On
xdebug.collect_return = On
xdebug.profiler_enable = On
xdebug.profiler_output_name = cachegrind.out.%t.%p
xdebug.trace_output_dir = "D:\BtSoft\temp\xdebug"
xdebug.profiler_output_dir ="D:\BtSoft\temp\xdebug"

;远程调试配置信息
;开启远程调试
xdebug.remote_enable = On
;远程处理协议
xdebug.remote_handel = dbgp
;IDE所在机器IP
;xdebug.remote_host = 127.0.0.1
;端口号
xdebug.remote_port = 9000
;IDE KEY
xdebug.idekey = "mykey"
xdebug.remote_connect_back= 1
重载配置

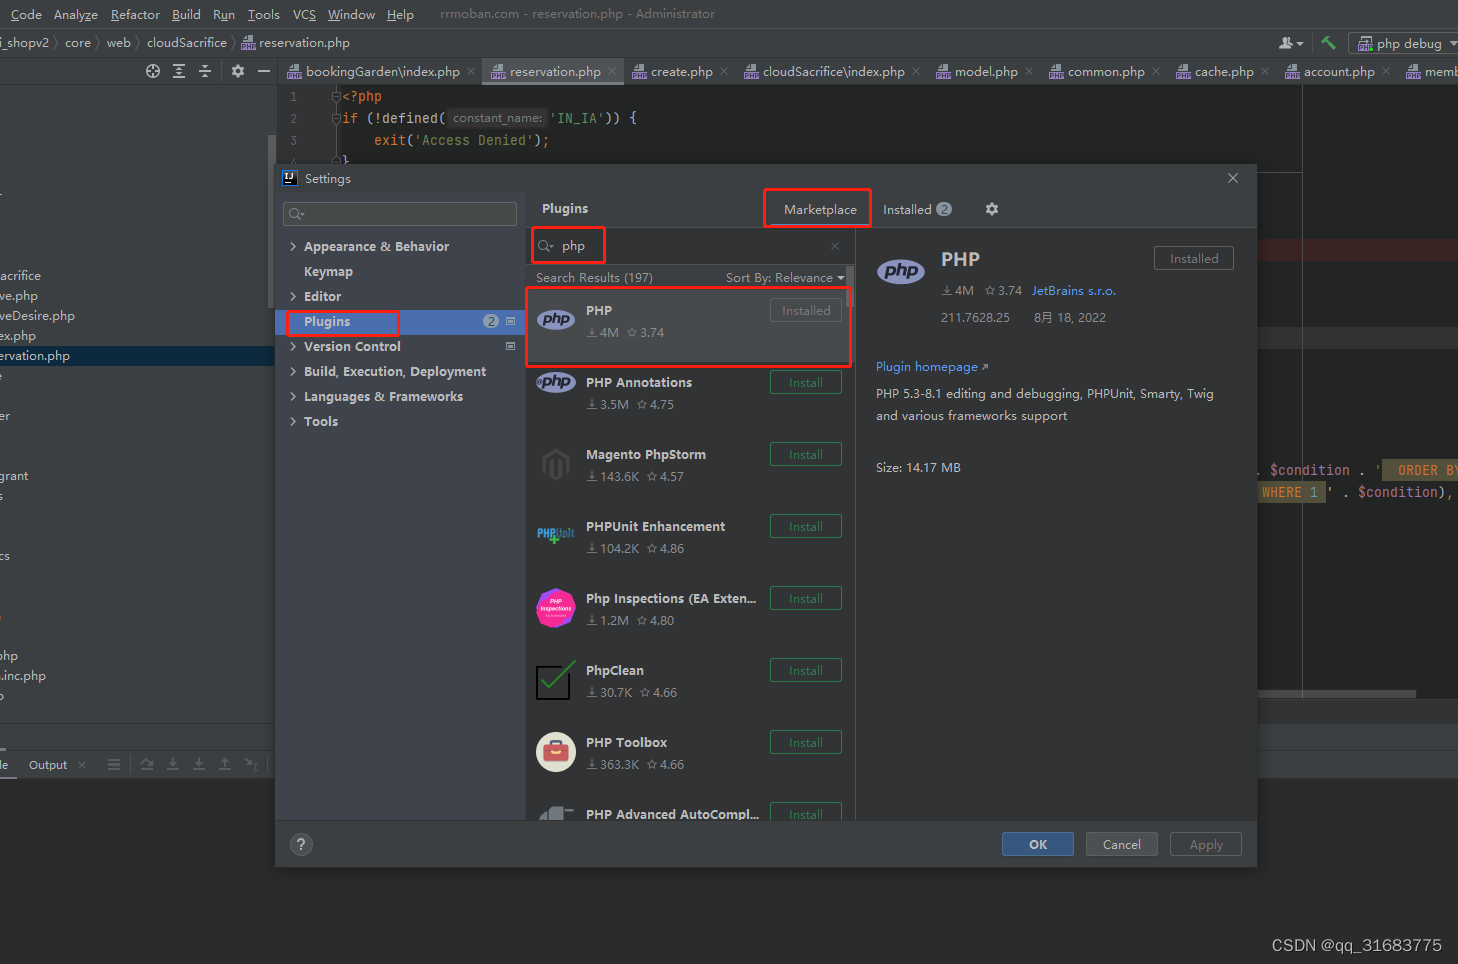
安装idea 旗舰版 社区版不能安装php插件

安装 idea 破解插件
链接:https://pan.baidu.com/s/1Qlpscprn1O7kuMofSXrrFA
提取码:2zhj
安装idea php插件
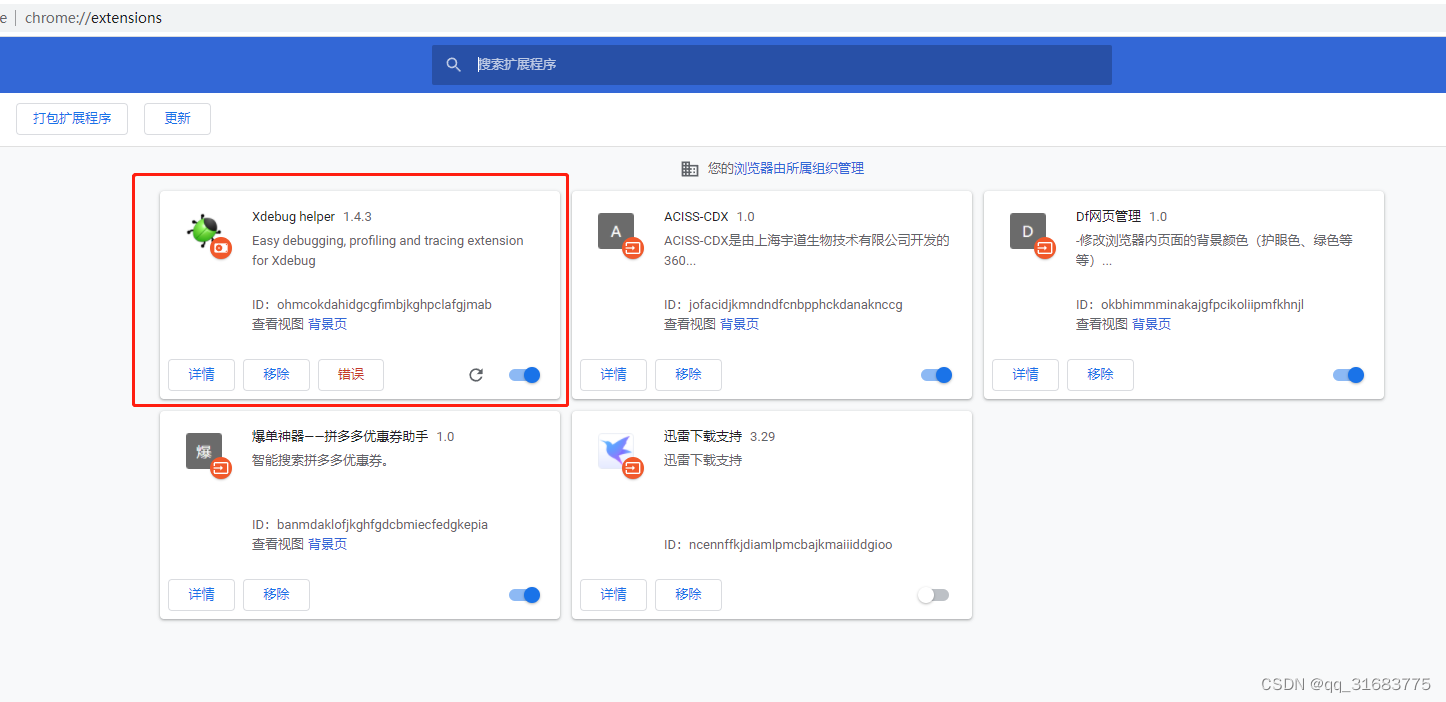
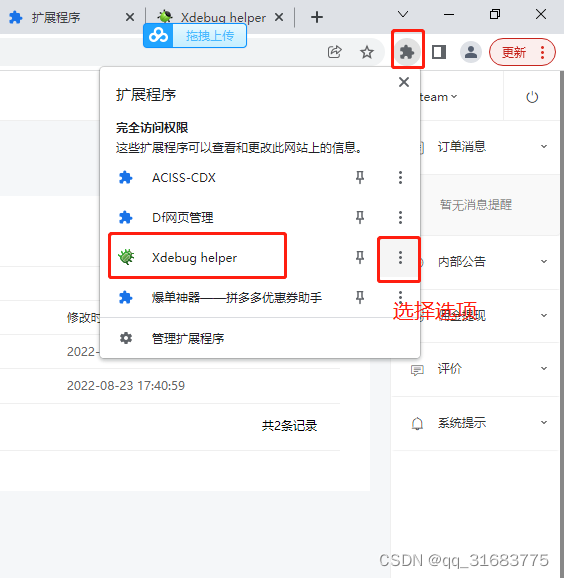
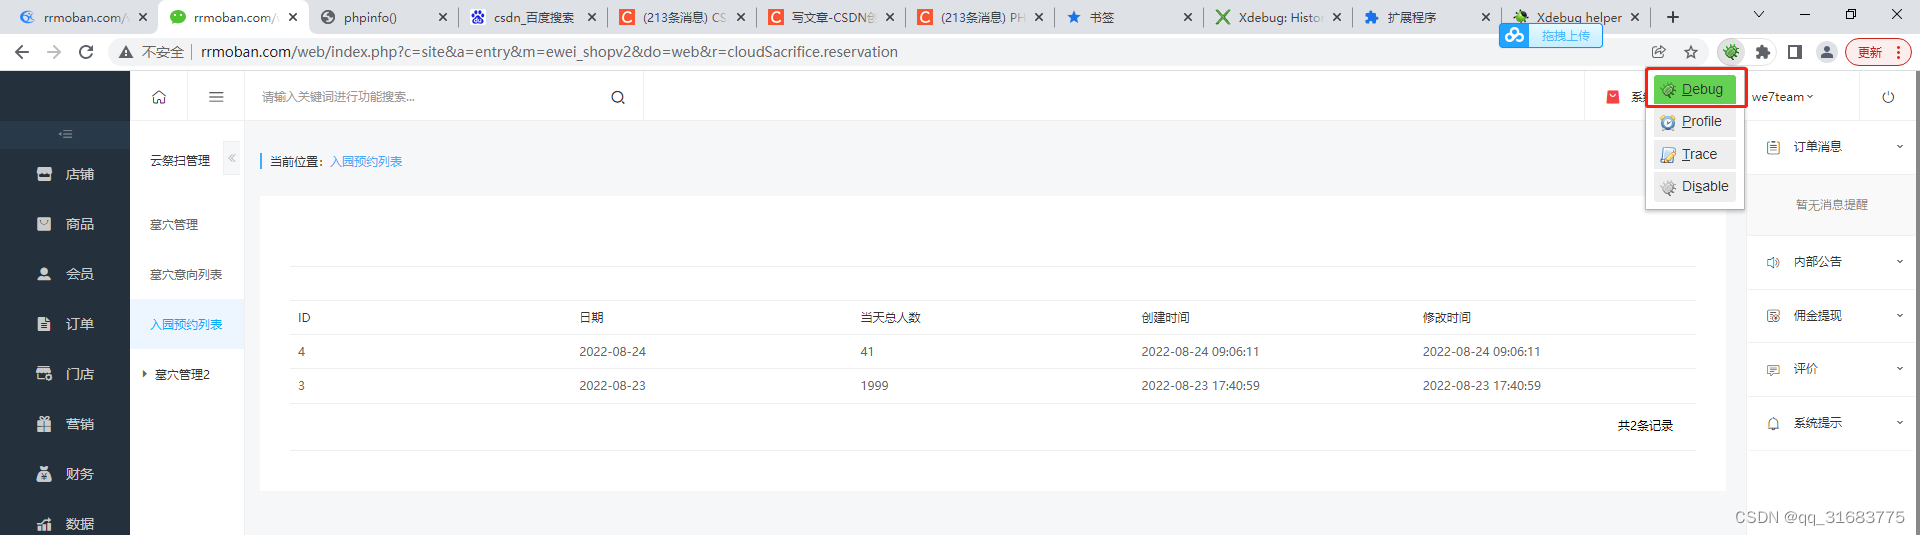
安装谷歌浏览器插件
链接:https://pan.baidu.com/s/149NpQl77ezFUPFXL8W2Esw
提取码:2nr8
打开php的页面
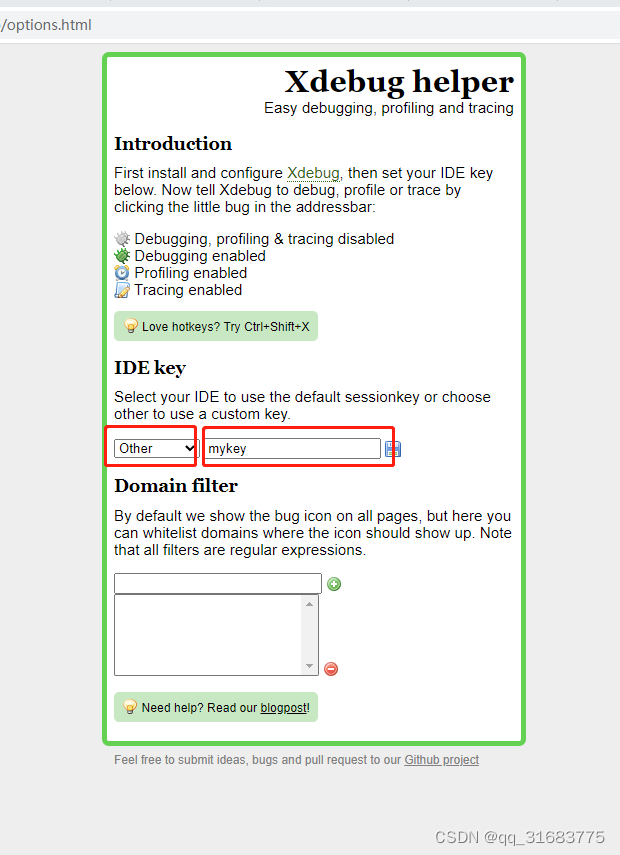
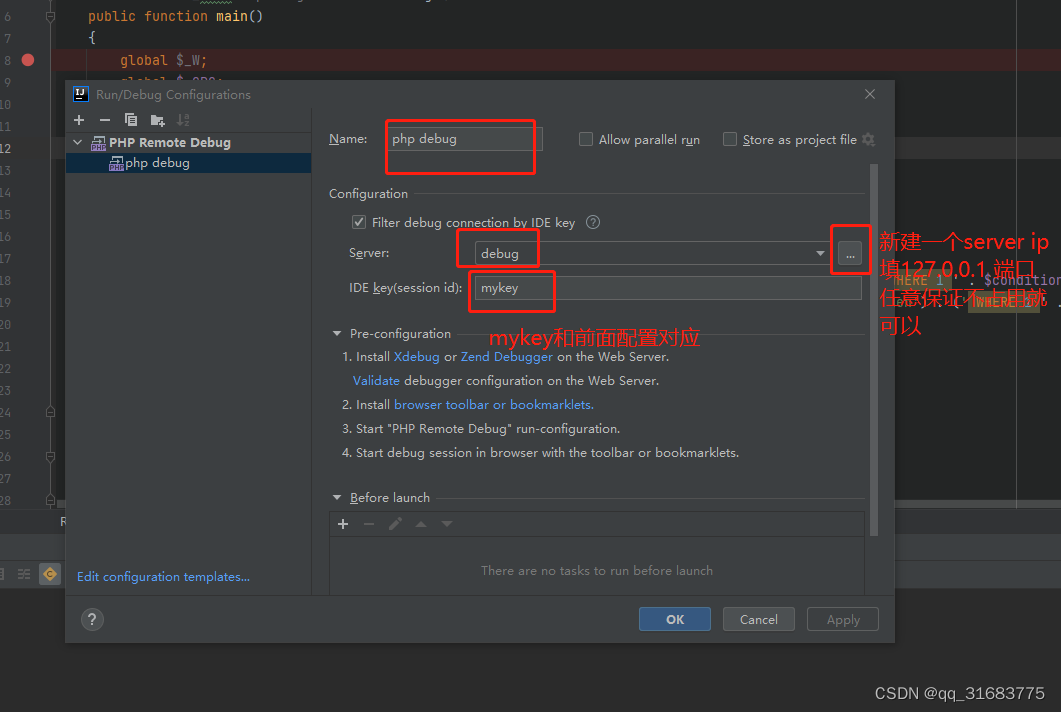
填入mykey , 和前面的对应
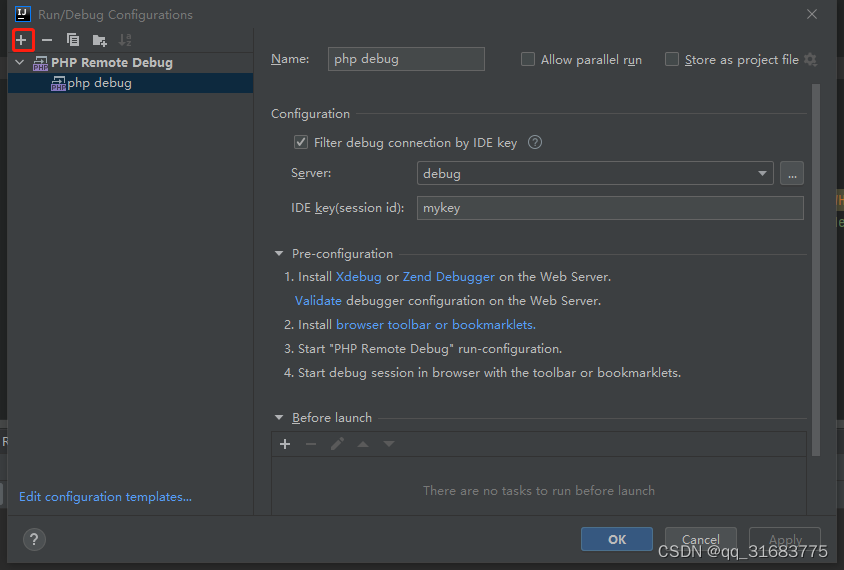
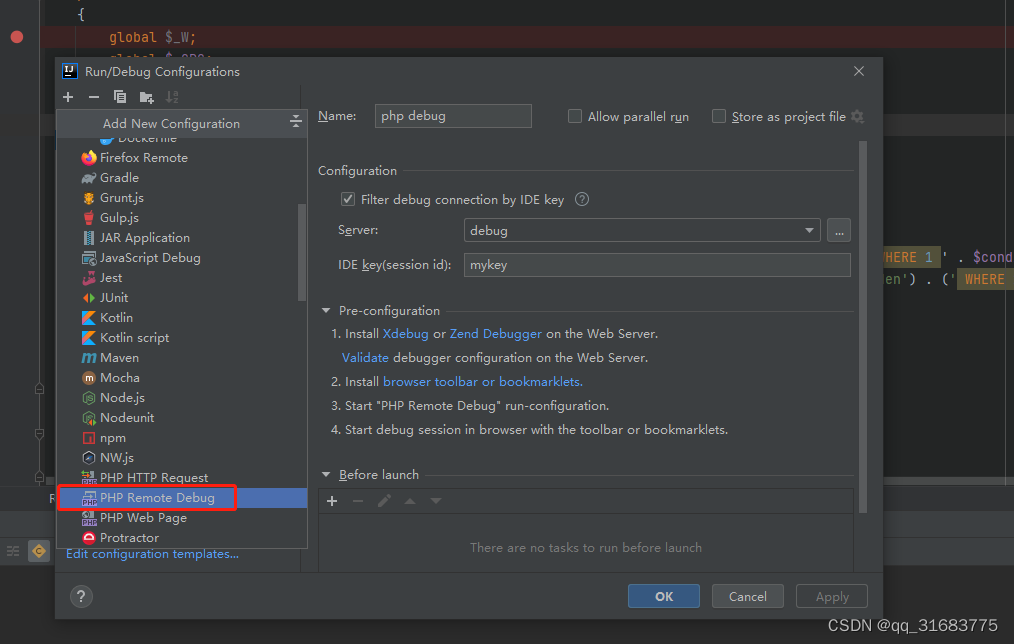
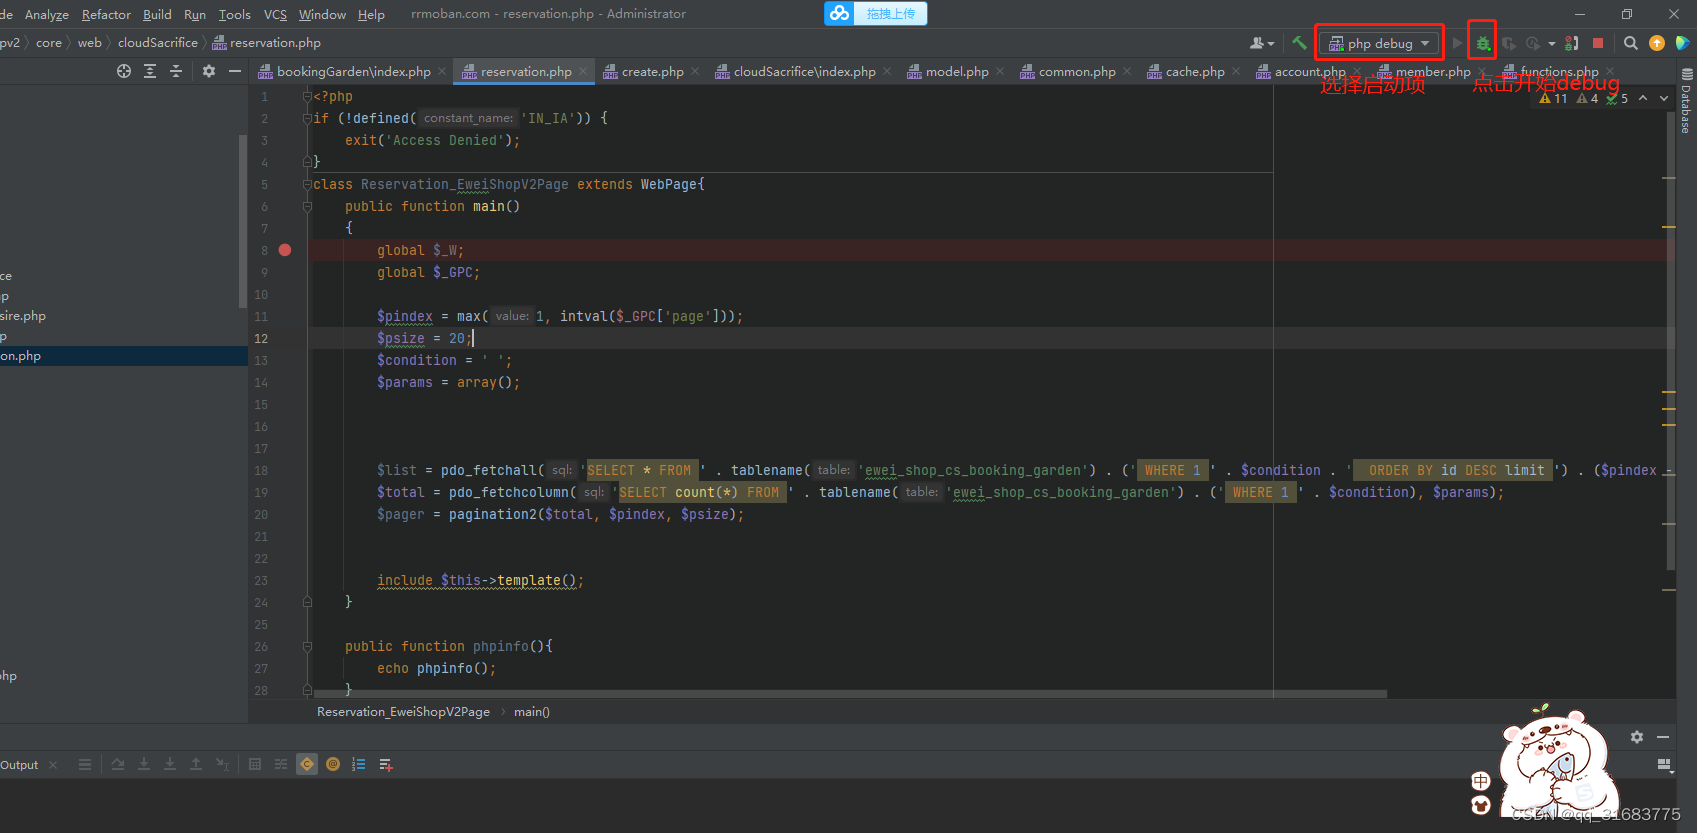
新建idea 运行项
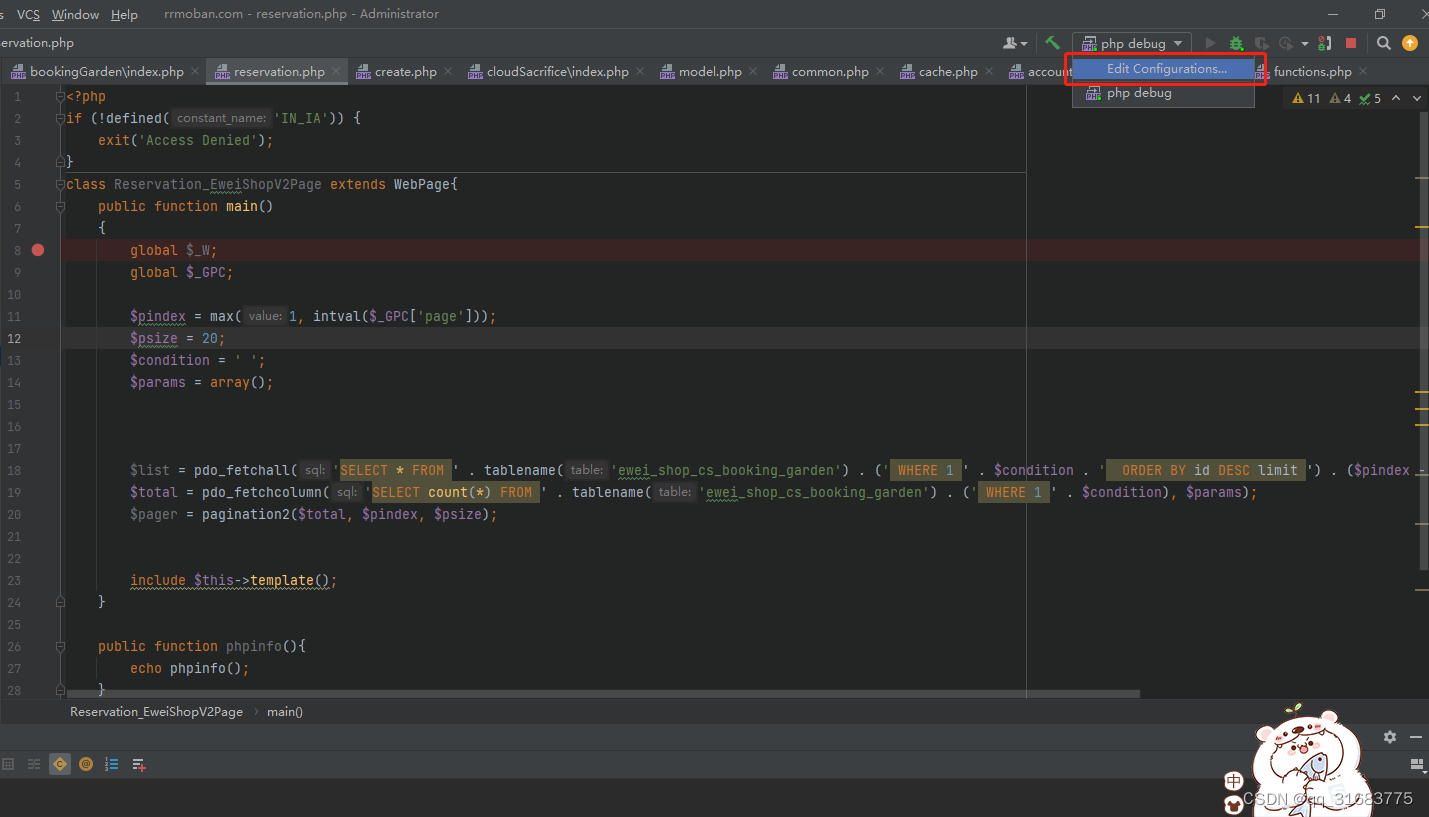
开始debug
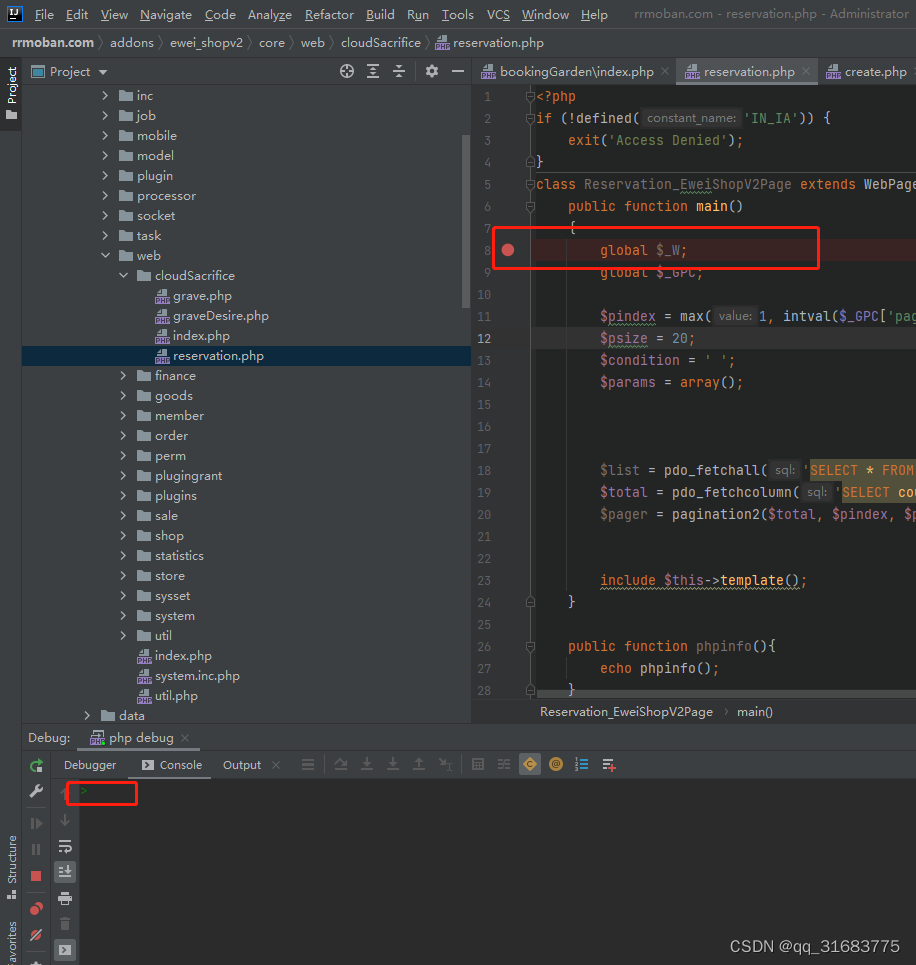
确定断点,去页面刷新页面
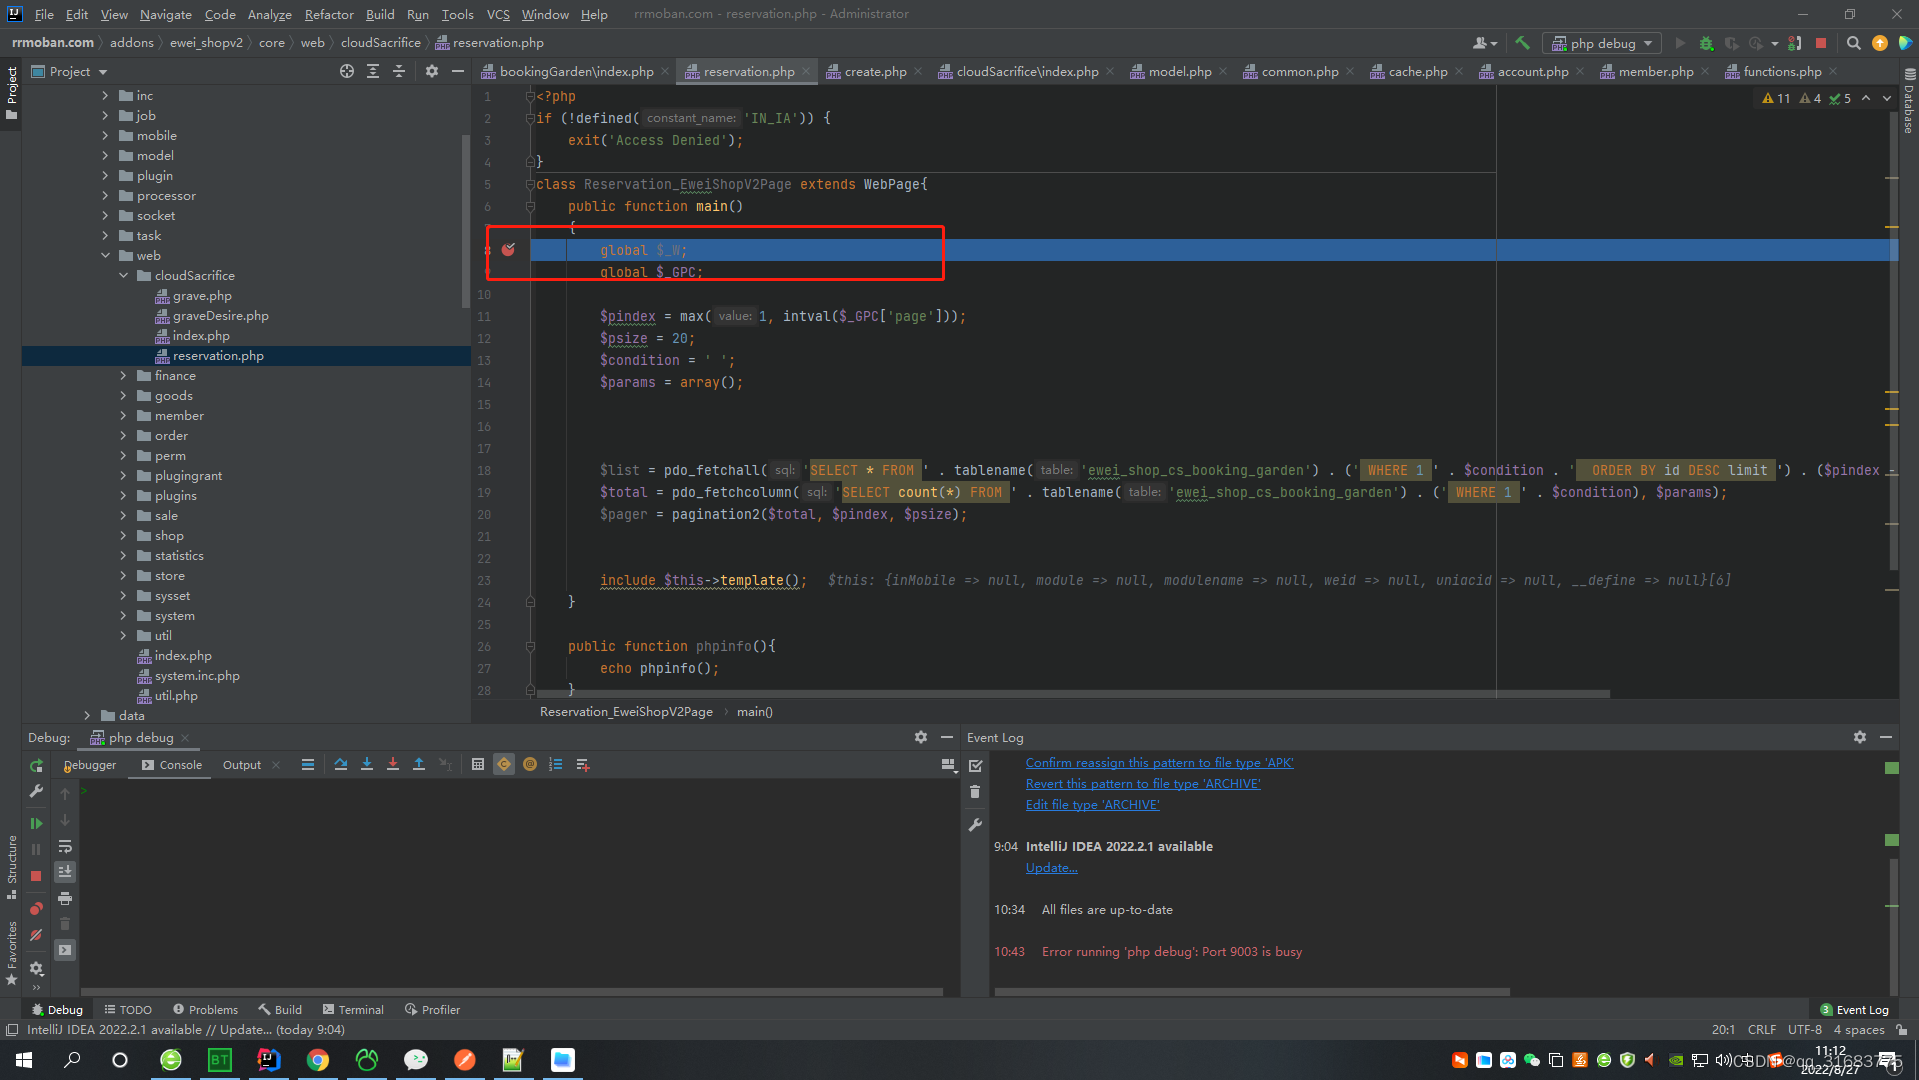
断点已经进来了
这下一个方法大几百行,就可以调试了
参考 PHP-PHP和IDEA调试配置_编程秀的博客-CSDN博客_idea 调试php
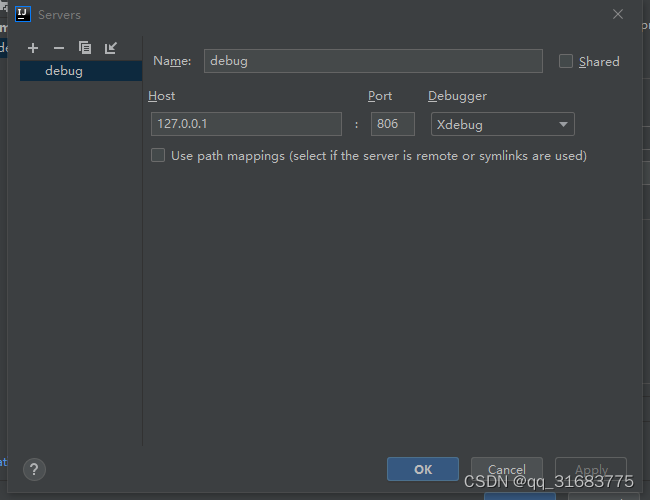
实际上只要php.ini中 xdebug.remote_port = 9009 配置的端口,和idea中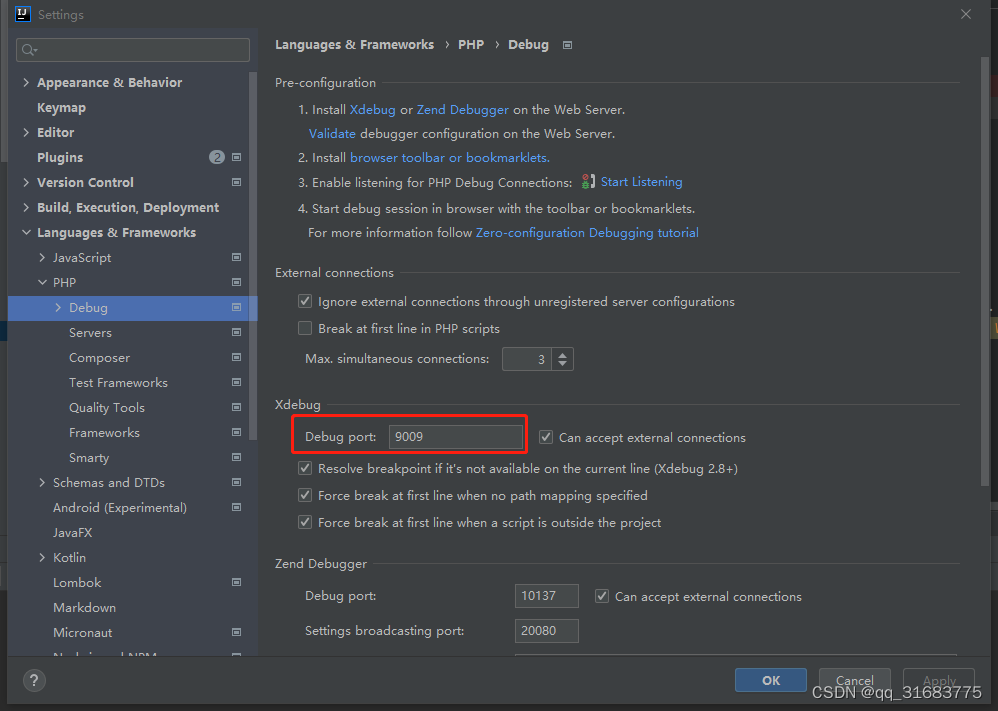
配置的端口一直,就可以调试
版权声明:本文为qq_31683775原创文章,遵循CC 4.0 BY-SA版权协议,转载请附上原文出处链接和本声明。