最近公司有个项目首页用到了echarts,没有接触过的小白一开始研究有点头大,以下是echart 版本5.0以上的使用方法
1.安装echarts依赖
npm install echarts -s2.引入echarts
重要提醒,我的版本是5以上的
"echarts": "^5.3.2",在main.js 全局引入
import * as echarts from 'echarts'
Vue.prototype.$echarts = echarts
3.在页面引用饼图
<template>
<div>
<div id="pie" :style="{width: '300px', height: '300px',margin:'0 auto'}"></div>
</div>
</template>
<script>
export default(){
data(){
return{
pieName:[], //图例名称
pieData: [] //数据
}
},
method:{
drawPie() {
var myChart1 = this.$echarts.init(document.getElementById('pie'));
var option1 = {
//hover显示提示语
tooltip: {
trigger: 'item',
formatter: '{a} <br/>{b} : {c} ({d}%)'
},
//图例
legend: {
y: 'bottom',
x: 'center', //底部居中
data: this.pieName, //图例名称,用的是动态的。可以写个静态试试效果
axisName: { //图例文字的样式
color: 'rgba(0, 0, 0, 1)',
fontSize: 14
}
},
series: [{
type: 'pie',//饼图
radius: ['40%', '70%'], //设置成环,第一个是内部半径,第二个是外圈半径
center: ['50%', '50%'], //中心点
color: ['rgba(59, 161, 255, 0.85)','rgba(253, 107, 108, 0.85)', 'rgba(243, 199, 4, 0.85)'], //饼图颜色
label: { //饼图图形上的文本标签
show: true,
position: 'inner', //文本内容显示在饼图上,设置为outer显示在外面
axisName: {
fontWeight: 700,
fontSize: 12, //文字的字体大小
color: '#000000'
},
formatter: '{c}' //显示值
},
data: this.pieData //动态数据
}]
};
myChart1.setOption(option1); //生成饼图
}
}
}
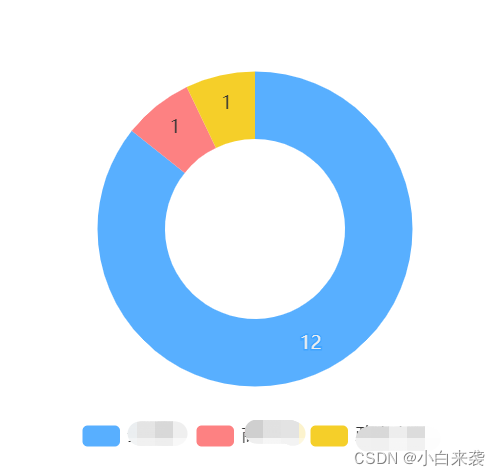
</script>显示结果截图
版权声明:本文为weixin_47218793原创文章,遵循CC 4.0 BY-SA版权协议,转载请附上原文出处链接和本声明。