ax,plt.subplot(111)
t = np.arange(0.0, 5.0, 0.01)
s = np.cos(2*np.pi*t)
line, = plt.plot(t, s, lw=2)
plt.annotate('local max', xy=(2, 1), xytext=(3, 1.5),
    arrowprops=dict(facecolor='black', shrink=0.08),
        )
plt.ylim(-2, 2)
plt.show()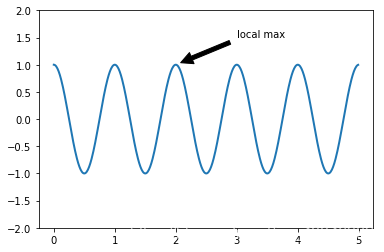
annotate
其中:
| key | Value |
|---|---|
| xy | to |
| xytext | from |
| arrowprops | 样式 |