code如下:
lb = -1:.25:.75;
for m = 1:length(lb)
for n = 1:length(lb)
h = text(lb(m)+.07,lb(n)+.12,num2str(pp(m,n))); %%关键是这句,循环写入每个格点内的数据量
set(h,'color','m','fontsize',10,'backgroundcolor',[.9 .9 .9]);
end
end
clear m n;
效果类似于图:
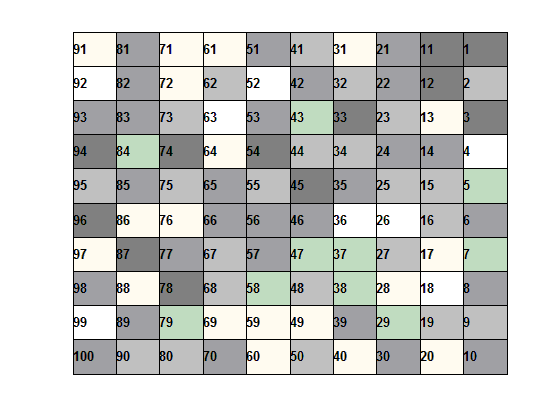
图来自:https://cn.mathworks.com/matlabcentral/answers/154877-how-to-plot-a-10-10-grid-map-and-how-to-number-the-grid-cells-sample-pic-is-attached-here
转载本文请联系原作者获取授权,同时请注明本文来自杨光科学网博客。
链接地址:http://blog.sciencenet.cn/blog-228329-1050077.html
上一篇:matlab 顺序运行多个.m文件
下一篇:外接显示器自动调整黑边解决办法