Selecting Data to Fit in Curve Fitting App
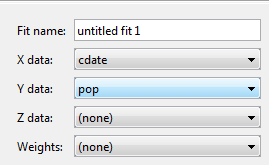
To select data to fit, use the drop-down lists in the Curve
Fitting app to select variables in your MATLAB® workspace.
To fit curves:
Select X data and Y
data.
Select only Y data to plot Y against
index (x=1:length( y )).
To fit surfaces, select X data, Y
data and Z data.
You can use the Curve Fitting app drop-down lists to select
any numeric variables (with more than one element) in your MATLAB workspace.
Similarly, you can select any numeric data in your workspace
to use as Weights.
For curves, X, Y, and Weights must be matrices with the same
number of elements.
For surfaces, X, Y, and Z must be either:
Matrices with the same number of elements
Data in the form of a table
For surfaces, weights must have the same number of
elements as Z.
When you select variables, the Curve Fitting app immediately
creates a curve or surface fit with the default settings. If you want
to avoid time-consuming refitting for large data sets, you can turn
off Auto fit by clearing the check box.
Note
The Curve Fitting app uses a snapshot of the data you select.
Subsequent workspace changes to the data have no effect on your fits.
To update your fit data from the workspace, first change the variable
selection, and then reselect the variable with the drop-down controls.