学习如何根据自己已有的数据制作数据集!
import os
from PIL import Image
import numpy as np
import tensorflow as tf
from tensorflow.keras.models import Model
from tensorflow.keras.layers import Flatten ,Dense,Conv1D,MaxPool1D
from tensorflow.keras.preprocessing.image import ImageDataGenerator
import matplotlib.pyplot as plt
x_train_path = './data/class4/FASHION_FC/fashion_image_label/fashion_train_jpg_60000/'
y_train_path = './data/class4/FASHION_FC/fashion_image_label/fashion_train_jpg_60000.txt'
x_test_path = './data/class4/FASHION_FC/fashion_image_label/fashion_test_jpg_10000/'
y_test_path = './data/class4/FASHION_FC/fashion_image_label/fashion_test_jpg_10000.txt'
x_train_savepath = './data/class4/FASHION_FC/fashion_image_label/fashion_x_train.npy'
y_train_savepath = './data/class4/FASHION_FC/fashion_image_label/fashion_y_train.npy'
x_test_savepath = './data/class4/FASHION_FC/fashion_image_label/fashion_x_test.npy'
y_test_savepath = './data/class4/FASHION_FC/fashion_image_label/fashion_y_test.npy'
def generateds(path,txt):
file = open(txt,'r')
lines = file.readlines()
file.close()
x,y_hat = [],[]
for line in lines:
value = line.split()
img_path = path +value[0]
img = Image.open(img_path)
img = np.array(img.convert('L'))
img = img /255.0
x.append(img)
y_hat.append(value[1])
print('loading'+line)
x = np.array(x)
y_hat = np.array(y_hat)
y_hat = y_hat.astype(np.int64)
return x,y_hat
if os.path.exists(x_train_savepath) and os.path.exists(y_train_savepath) \
and os.path.exists(x_test_savepath) and os.path.exists(y_test_savepath):
print('-------------------load datasets----------------------')
x_train = np.load(x_train_savepath)
x_train = np.reshape(x_train,(len(x_train),28,28))
y_train = np.load(y_train_savepath)
x_test = np.load(x_test_savepath)
x_test = np.reshape(x_test,(len(x_test),28,28))
y_test = np.load(y_test_savepath)
else:
print('-------------------generate datasets------------------')
x_train,y_train = generateds(x_train_path,y_train_path)
x_test, y_test = generateds(x_test_path,y_test_path)
print('-------------------save datasets----------------------')
x_train_save = np.reshape(x_train,(len(x_train),-1))
x_test_sava = np.reshape(x_test,(len(x_test),-1))
np.save(x_train_savepath,x_train_save)
np.save(y_train_savepath,y_train)
np.save(x_test_savepath,x_test_sava)
np.save(y_test_savepath,y_test)
class Mymodel(Model):
def __init__(self):
super(Mymodel, self).__init__()
self.c1 = Conv1D(filters=256,kernel_size=2,padding='same',activation='relu')
self.m1 = MaxPool1D(pool_size=2,strides=2,padding='same')
self.flatten = Flatten()
self.d1 = Dense(units=128,activation=tf.keras.activations.relu)
self.d2 = Dense(units=10,activation=tf.keras.activations.softmax)
def call(self,x):
x = self.c1(x)
x = self.m1(x)
x = self.flatten(x)
x = self.d1(x)
y = self.d2(x)
return y
model = Mymodel()
model.compile(optimizer='adam',
loss=tf.keras.losses.SparseCategoricalCrossentropy(from_logits=False),
metrics=['sparse_categorical_accuracy'])
# 数据增强 image_gen_train 提高正确率
# x_train = x_train.reshape(x_train.shape[0],28,28,1) # 给数据增加一个维度,使数据和网络结构匹配
#
# image_get_train = ImageDataGenerator(
# rescale=1. / 1., # 如为图像,分母为255时,可归全 0~1
# rotation_range= 45 , # 随机 45 度旋转
# width_shift_range= .15, # 宽度偏移
# height_shift_range=.15 , # 高度偏移
# horizontal_flip=True, # 水平翻转
# zoom_range= 0.5 # 将图像随机缩放阈值50%
# )
# image_get_train.fit(x_train)
checkpoint_save_path = './models/fashionconv/fashion.ckpt'
if os.path.exists(checkpoint_save_path+'.index'):
print('-------------load model-----------')
model.load_weights(checkpoint_save_path)
cp_callback = tf.keras.callbacks.ModelCheckpoint(filepath=checkpoint_save_path,
save_weights_only=True,
save_best_only=True)
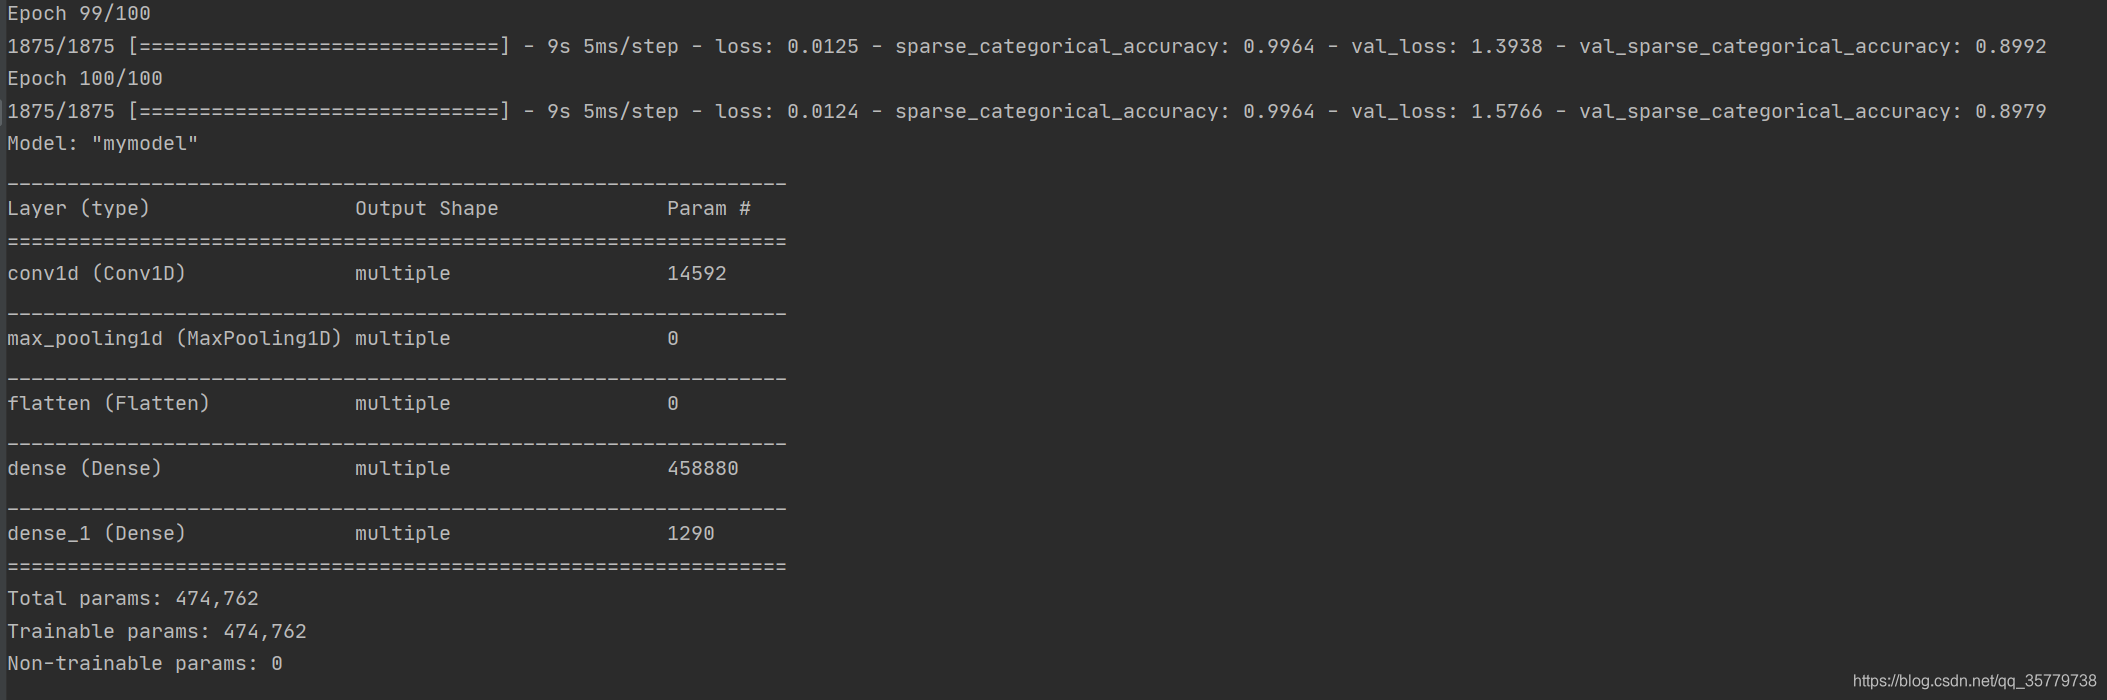
history = model.fit(x_train,y_train,batch_size=32,
epochs=100,
validation_data=(x_test,y_test),
validation_freq=1,
callbacks=[cp_callback])
model.summary()
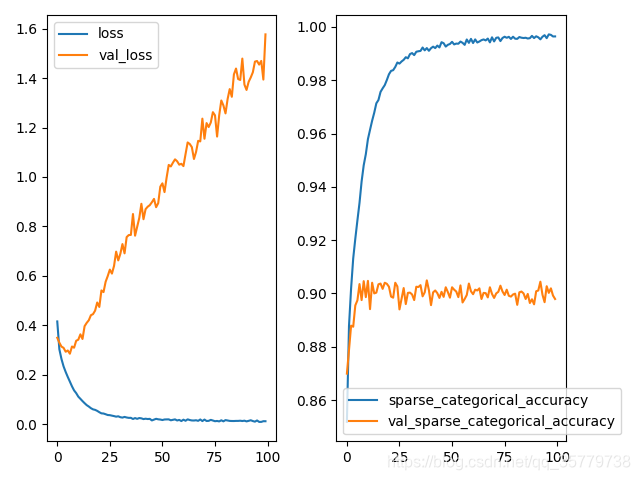
plt.subplot(121)
plt.plot(history.history['loss'],label='loss')
plt.plot(history.history['val_loss'],label = 'val_loss')
plt.legend()
plt.subplot(122)
plt.plot(history.history['sparse_categorical_accuracy'],label='sparse_categorical_accuracy')
plt.plot(history.history['val_sparse_categorical_accuracy'],label = 'val_sparse_categorical_accuracy')
plt.legend()
plt.show()
版权声明:本文为qq_35779738原创文章,遵循CC 4.0 BY-SA版权协议,转载请附上原文出处链接和本声明。