一、学习内容
在Python Dash(四)的基础上加入dash_core_components组件Default Dropdown实现动态交互数据可视化图表
二、学习过程
1、Default Dropdown官方文档https://dash.plotly.com/dash-core-components/dropdown
2、跑官方文档案例
# author : 高冷男孩不吃苹果

import plotly.express as px
import dash
import dash_core_components as dcc
import dash_html_components as html

app = dash.Dash(__name__)
df = px.data.iris()
fig = px.scatter(df, x="sepal_width", y="sepal_length", color="species", marginal_y="violin",
           marginal_x="box", trendline="ols", template="simple_white")
graph = dcc.Graph(figure=fig) #创建图
app.layout = html.Div([
    dcc.Dropdown(
        id='demo-dropdown',
        options=[
            {'label': 'New York City', 'value': 'NYC'},
            {'label': 'Montreal', 'value': 'MTL'},
            {'label': 'San Francisco', 'value': 'SF'}
        ],
        value='NYC'
    ),
    html.Div(id='dd-output-container'),
    graph
])


@app.callback(
    dash.dependencies.Output('dd-output-container', 'children'),
    [dash.dependencies.Input('demo-dropdown', 'value')])
def update_output(value):
    return 'You have selected "{}"'.format(value)


if __name__ == '__main__':
    app.run_server(debug=True)
运行结果:
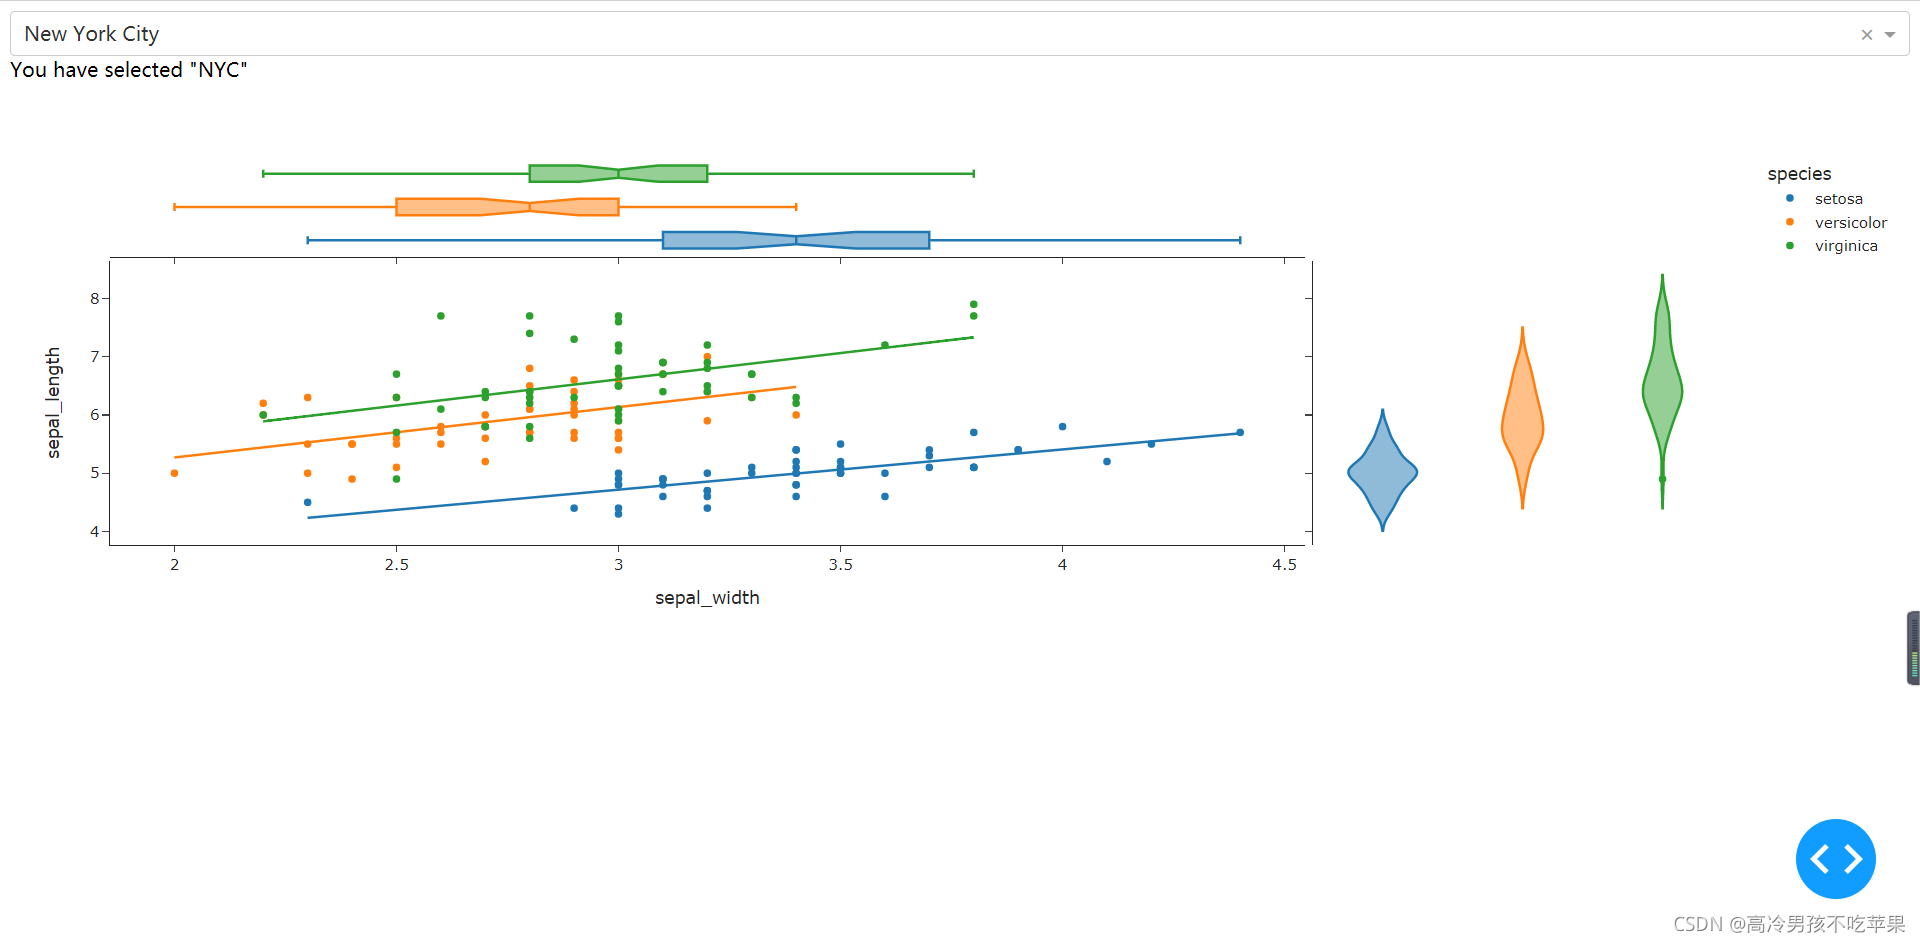
注:下拉菜单虽然已经添加到网页中,但是与之前的表格之间并无联系
3、创建联系
鸢尾花数据中存在sepal_length、sepal_width、petal_length、petal_width、species这几列数据,我们做的事情是绘制一个散点图,散点图的y轴始终是species,而其x轴则可以从sepal_length、sepal_width、petal_length、petal_width选择。
代码:
# author : 高冷男孩不吃苹果

import plotly.express as px
import dash
import dash_core_components as dcc
import dash_html_components as html

app = dash.Dash(__name__)
df = px.data.iris()
sepal_width = df['sepal_width']
sepal_length = df['sepal_length']
petal_length = df['petal_length']
petal_width = df['petal_width']
species = df['species']
fig = px.scatter(x=sepal_width, y=species)
graph = dcc.Graph(figure=fig,  id='graph1') #创建图
dropDown = dcc.Dropdown(
        id='demo-dropdown',
        options=[
            {'label': 'Sepal Width', 'value': 'sepal_width'},
            {'label': 'Sepal Length', 'value': 'sepal_length'},
            {'label': 'Petal Length', 'value': 'petal_length'},
            {'label': 'Petal Width', 'value': 'petal_width'}
        ],
        value='sepal_width'
    )
app.layout = html.Div([
    dropDown,
    graph
])

@app.callback(
    dash.dependencies.Output('graph1', 'figure'),
    [dash.dependencies.Input('demo-dropdown', 'value')])
def update_output(value):
    return px.scatter(x=df[value], y=species)


if __name__ == '__main__':
    app.run_server(debug=True)
运行结果:

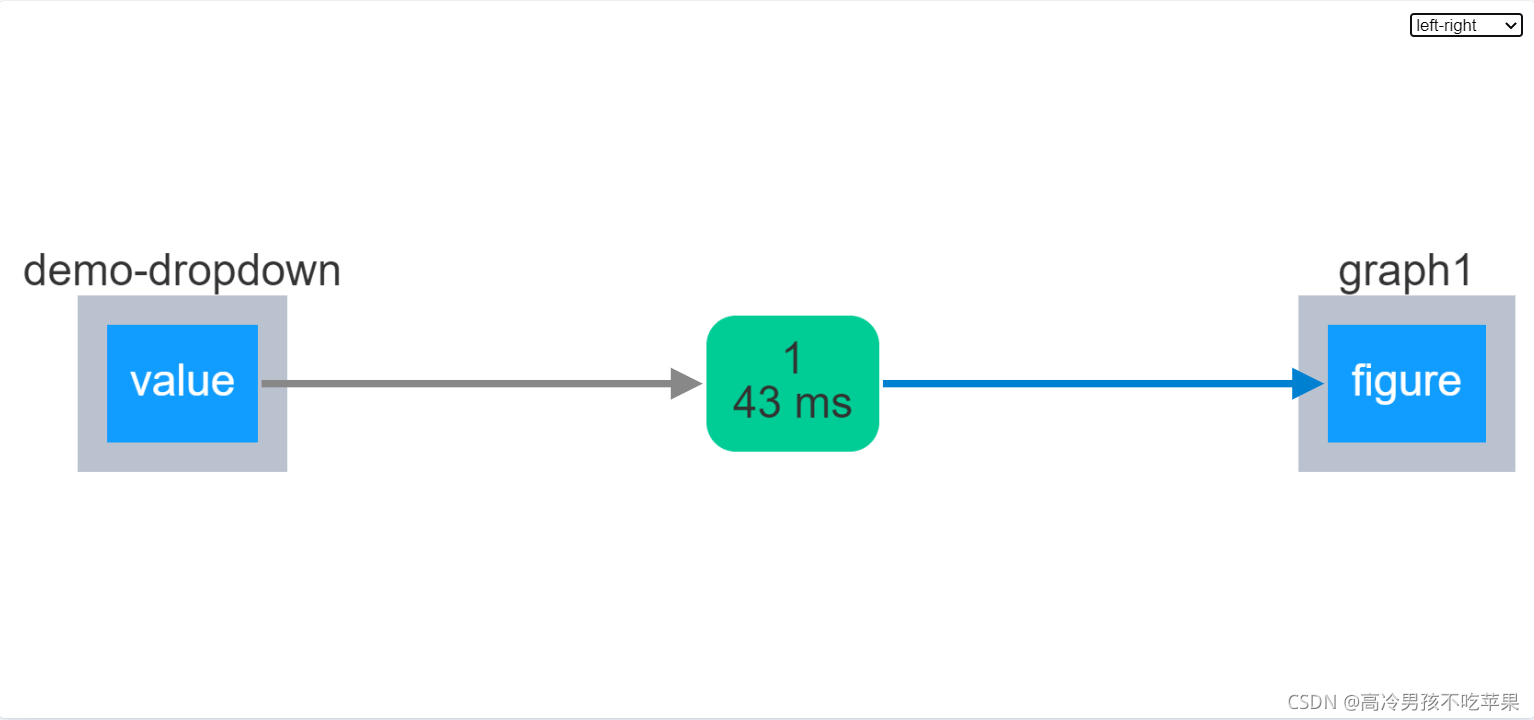
查看数据流向:
三、总结
核心是数据流向和数据处理。
版权声明:本文为lcf0000原创文章,遵循CC 4.0 BY-SA版权协议,转载请附上原文出处链接和本声明。