下载
首先,下载 GitHub 上的 ecomfe/echarts-for-weixin 项目。其中,ec-canvas 是官方提供的组件,其他文件是如何使用该组件的示例。
其次,将下载的项目中的ec-canvas文件放入到小程序项目中,和pages同级。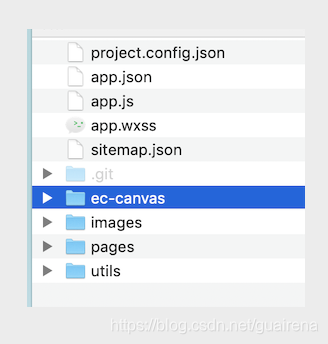
在页面使用echarts
如在,pages/index文件下引入echarts
1. 在 pages/index/index.json 文件下进行如下配置{ "navigationBarTitleText": "首页", "usingComponents": { "ec-canvas": "../../../ec-canvas/ec-canvas" }, "navigationBarBackgroundColor": "#E8380D", "navigationBarTextStyle": "white" }
在 pages/index/index.js 文件开始引入
import * as echarts from '../../../ec-canvas/echarts';在 pages/index/index.wxml 文件创建元素
<view class="chart-map">
   <ec-canvas id="ec-DayBoxOfficeBar" ec="{{ ecDayBoxOfficeBar }}"></ec-canvas>
</view>
在 pages/index/index.wxss 中设置样式
.chart-map {
  width: 100%;
  height: 460rpx;
}
.chart-map ec-canvas {
  width: 100%;
  height: 100%;
}
在 pages/index/index.js 文件编写图表配置项及初始化和数据赋值
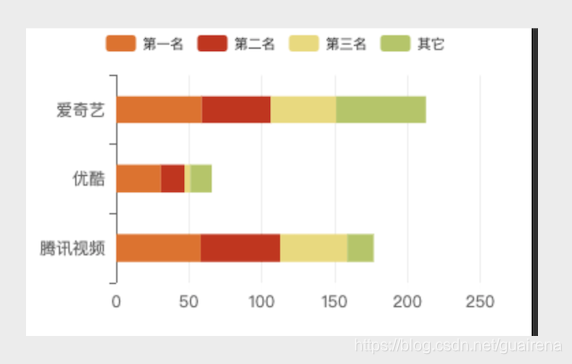
var app = getApp()
var util = require('../../../utils/util.js')
import * as echarts from '../../../ec-canvas/echarts';

var optionLeft1 = {
  color: ['#eb6c10', '#cf2306', '#ebd970', '#b1c75b'],
  tooltip: {
    trigger: 'axis',
    axisPointer: {
      type: 'shadow'
    }
  },
  legend: {
    x: 'center',
    y: 'top',
    data: ['第一名', '第二名', '第三名', '其它'],
    // icon: 'circle',
    itemWidth: 22,
    itemHeight: 12,
    textStyle: {
      color: '#333',
      fontSize: 10
    }
  },
  grid: {
    left: '4%',
    right: '10%',
    top: '15%',
    bottom: '10%',
    containLabel: true
  },
  xAxis: [{
    type: 'value',
    // name: '万元',
    nameTextStyle: {
      color: '#666'
    },
    axisLabel: {
      color: '#666'
    },
    axisLine: {
      show: false,
      lineStyle: {
        color: '#fefefe'
      }
    },
    axisTick: { show: true },
    splitLine: {
      lineStyle: {
        color: '#eee',
        // type: 'dotted'
      }
    }
  }],
  yAxis: [{
    type: 'category',
    inverse: true,
    data: [],
    axisLabel: {
      color: '#666',
      type: 'dotted',
      interval: 0,
      // rotate: 30
    },
    axisLine: {
      show: true,
      lineStyle: {
        color: '#666'
      }
    },
  }],
  series: [{
    name: '第一名',
    type: 'bar',
    barWidth: '40%',
    stack: '票房',
    data: []
  }, {
    name: '第二名',
    type: 'bar',
    barWidth: '40%',
    stack: '票房',
    data: []
  }, {
    name: '第三名',
    type: 'bar',
    barWidth: '40%',
    stack: '票房',
    data: []
  }, {
    name: '其它',
    type: 'bar',
    barWidth: '40%',
    stack: '票房',
    data: []
  }]
}

Page({
	data: {
		ecDayBoxOfficeBar: {
	      lazyLoad: true
	    },
	    platChartParams: {
	      dateStart: '2021-3-20',
	    }
	},

	getPlatChart: function (query) {
    util.dataInformation('加载中', `/chart/platform`, 'GET', query, res => {
      if (res.data.data) {
        var data = res.data.data
        optionLeft1.yAxis[0].data = data[0]
        optionLeft1.series[0].data = data[1]
        optionLeft1.series[1].data = data[2]
        optionLeft1.series[2].data = data[3]
        optionLeft1.series[3].data = data[4]
        if(this.chartDayBoxOffice == undefined) {
          this.initChart(this.ecDayBoxOfficeBar, optionLeft1, 'chartDayBoxOffice')
        } else {
          this.chartDayBoxOffice.clear()
          this.initChart(this.ecDayBoxOfficeBar, optionLeft1, 'chartDayBoxOffice')
        }
      }
    })
  },

  onLoad: function (options) {
	this.ecDayBoxOfficeBar = this.selectComponent('#ec-DayBoxOfficeBar');
    this.getPlatChart(this.data.platChartParams)
  },

   /**
   *
   * @param {Component} ecComponent
   * @param {echartOption} options
   * @param {String} key
   */
  initChart(ecComponent, options, key) {
    ecComponent.init((canvas, width, height) => {
      const chart = echarts.init(canvas, null, {
        width: width,
        height: height
      });
      chart.setOption(options, true)
      this[key] = chart;
      return chart;
    });
  }

})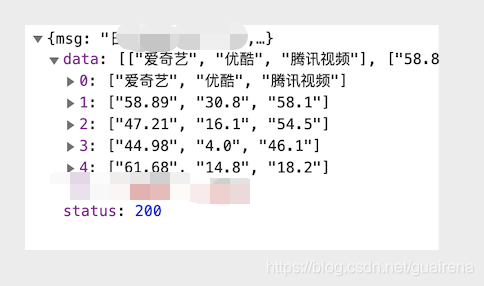
版权声明:本文为guairena原创文章,遵循CC 4.0 BY-SA版权协议,转载请附上原文出处链接和本声明。